Embed User Surveys Pro
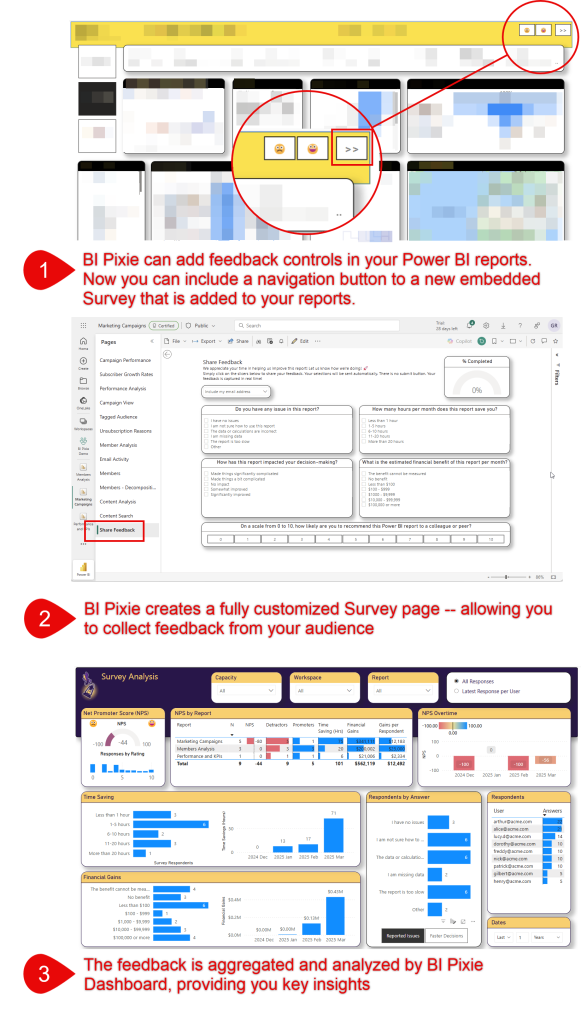
With BI Pixie you can embed surveys directly inside your Power BI reports to collect structured feedback from your audience. The embedded survey is a native Power BI page that BI Pixie adds to your target reports. BI Pixie also offers lightweight feedback controls for quick thumbs-up/down reactions. You can use either or both on the same reports.
The Survey Page
When surveys are enabled in the Settings page of the BI Pixie Portal, BI Pixie adds a survey page to the end of your report.
The survey questions are fully customizable. They can be about the reports themselves (e.g., satisfaction, usability) or the business domain the reports cover (e.g., financial impact, decision quality). The default questions below are our recommended starting point, but you can change the question text and answer options to anything that fits your needs. You are only bound by the supported formats (slicer-based single selection per question).
The default questions included in the survey are:
| Question Type | What It Measures |
|---|---|
| Collects the respondent's email address for follow-up. | |
| NPS (Net Promoter Score) | How likely users are to recommend the report to colleagues. BI Pixie Dashboard calculates the NPS score from the responses. |
| Issues | What problems or blockers users experience with the report. |
| Time Saved | How much time the report saves users in their work. |
| Decision Making | How the report influences business decisions. |
| Financial Benefit | The estimated financial value the report delivers per month. |
Each question uses a slicer with predefined answer options. When a user selects an answer, the response is sent to BI Pixie as an event. In Settings, you can toggle individual questions on or off, and customize the question text and answer options for each one.
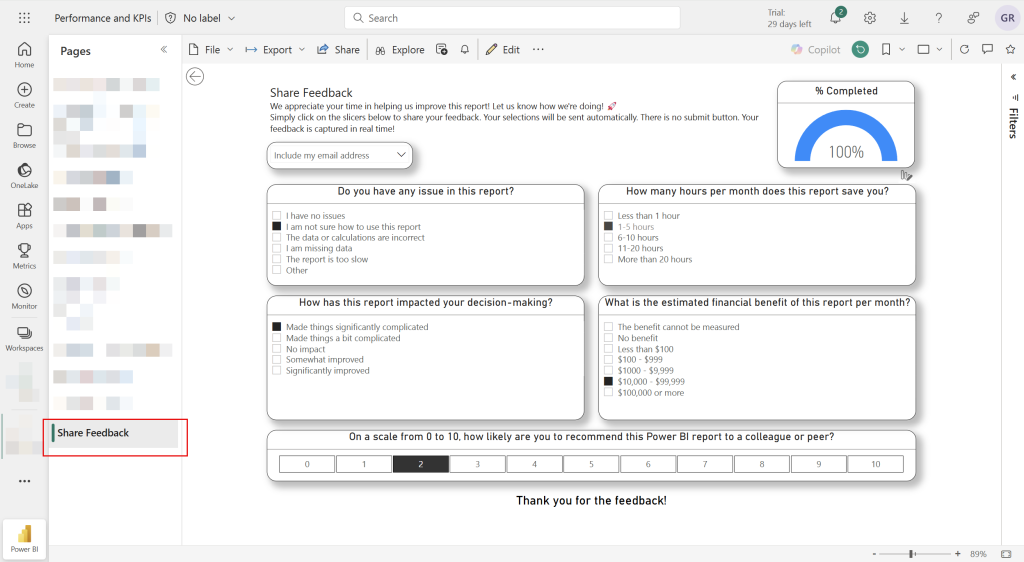
Here is what the survey page looks like for your report consumers:
Configure Surveys
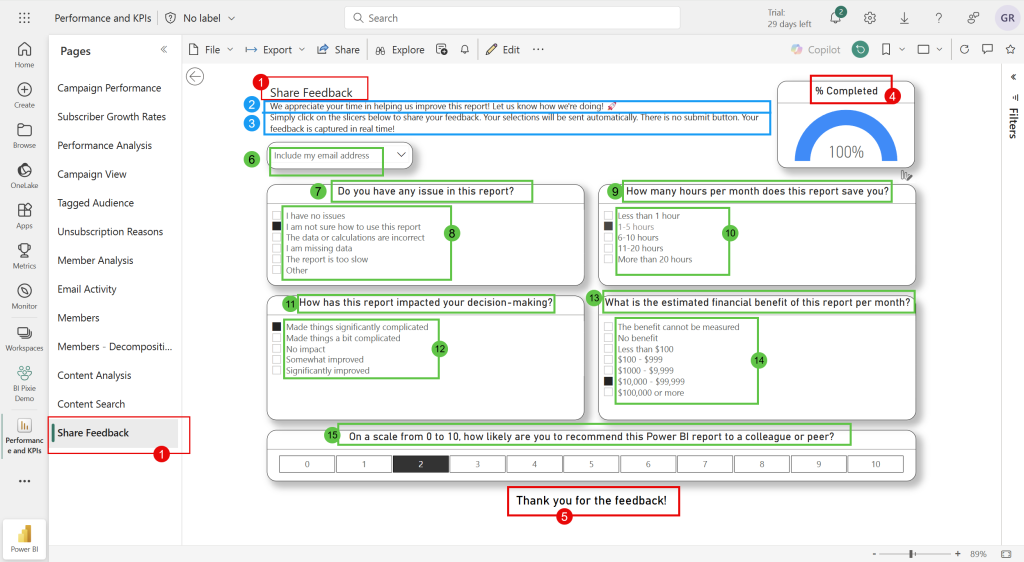
The following annotated screenshot highlights all the customizable elements of the survey page. The red numbers correspond to the settings described below.
- In the BI Pixie Portal, navigate to the Settings page.
- Select the level where you want to enable surveys. We recommend enabling this at the workspace or report level for specific reports, rather than at the account level.
- Scroll to the Add survey section and toggle it on.
- Configure the survey page layout:
- Survey page name and title (Element 1) — The page tab name and the heading at the top of the survey page (default: "Share Feedback").
- Survey page description (Element 2) — The first sentence below the title, introducing the survey to respondents.
- Survey page instructions (Element 3) — The second sentence below the title, explaining how to use the slicers.
- Survey progress gauge title (Element 4) — Title for the progress indicator at the top right. The gauge fills as users answer questions (default: "% Completed").
- Survey thank you title (Element 5) — The message shown at the footer when all questions are answered (default: "Thank you for the feedback!").
- Configure the survey questions. Each question can be toggled on or off, and you can customize the question text and answer options using the answer list editor:
- Email (Element 6) — Lets respondents choose whether to share their email or stay anonymous. The answer options are fixed ("Include my email address" and "Stay anonymous").
- Issues (Elements 7 & 8) — Asks about problems or blockers users experience with the report. You can add, remove, and reorder the answer options. Values are assigned automatically (0, 1, 2, ...) and used to identify each answer in the dashboard.
- Time Saved (Elements 9 & 10) — Asks how many hours per month the report saves the user. Each answer has an editable Hours value that represents the numeric hours for that option. For example, "1-5 hours" has a value of 1, and "11-20 hours" has a value of 11. BI Pixie Dashboard uses these values to calculate total and average hours saved across respondents and reports.
- Decision Making (Elements 11 & 12) — Asks how the report has impacted the user's decision-making. Values range from negative (complicated) to positive (improved), allowing the dashboard to measure the overall decision-making impact.
- Financial Benefit (Elements 13 & 14) — Asks for the estimated monthly financial savings or gain. Each answer has an editable Amount value representing the dollar amount for that option. For example, "$1000 - $9,999" has a value of 1000. BI Pixie Dashboard uses these values to calculate total and average financial gains across respondents and reports. Use -1 for "The benefit cannot be measured" to exclude it from aggregations.
- NPS (Net Promoter Score) (Element 15) — Asks how likely users are to recommend the report to colleagues on a 0–10 scale. BI Pixie Dashboard calculates the standard NPS score by classifying respondents as Promoters (9-10), Passives (7-8), or Detractors (0-6).
- Configure navigation to the survey page:
- Add navigation buttons from all pages to survey — When on, BI Pixie adds a button on each report page that takes users to the survey page.
- Survey button label — The text on the navigation button (default: "Share feedback").
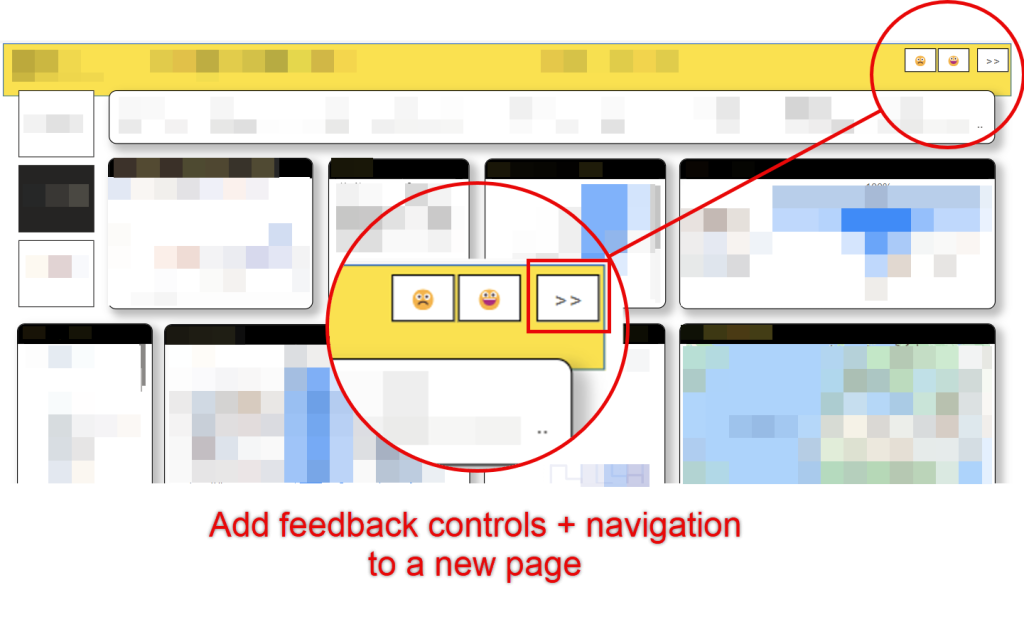
The navigation button appears on your report pages, giving users a direct link to the survey. - Click Save settings.
- Navigate to the Add Pixies page and update Pixies on the affected reports to apply the survey.
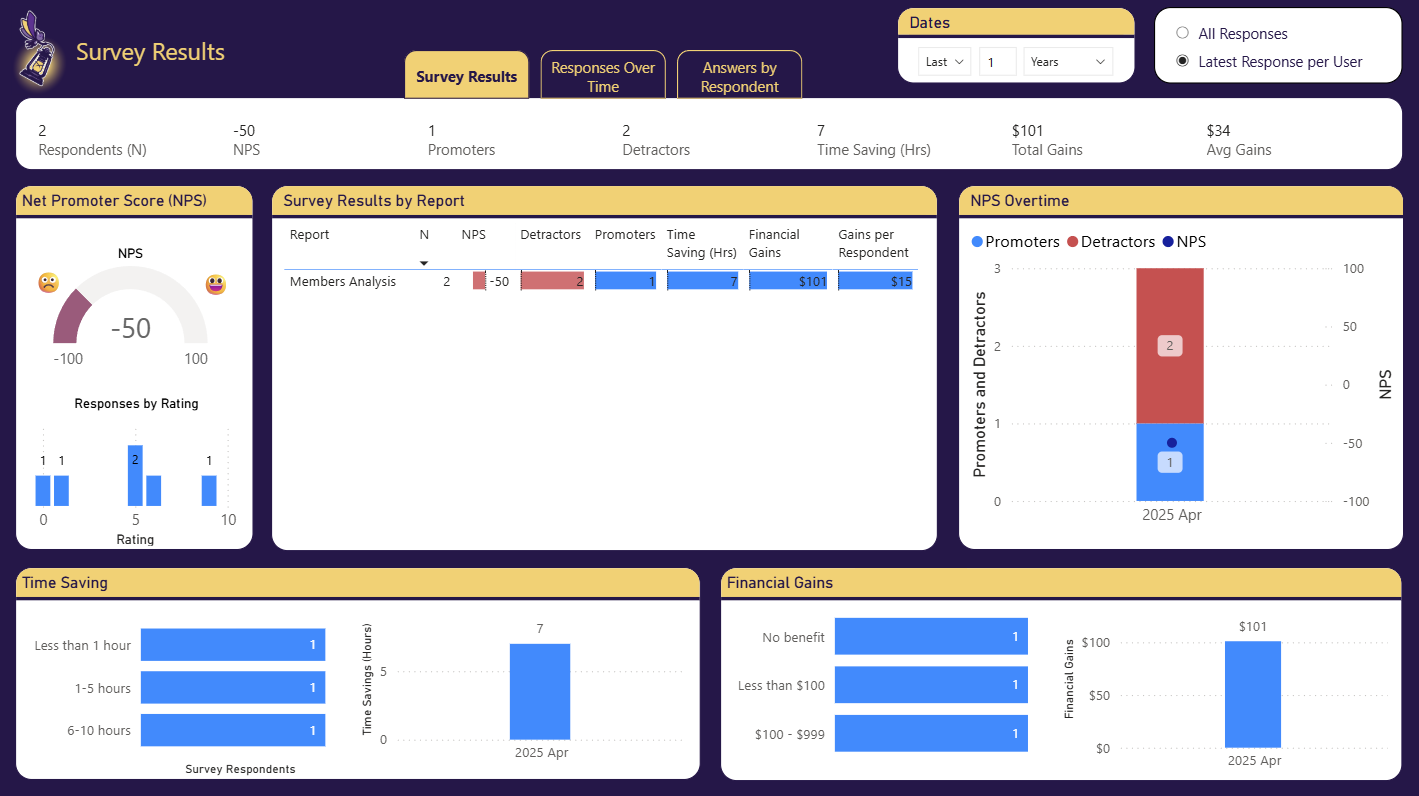
Analyzing Survey Results
All survey responses are captured automatically and available in BI Pixie Dashboard. The Survey Results page provides a comprehensive view of NPS scores, time savings, financial benefits, and decision-making impact across your reports.
Semantic Model Requirements
To add a survey, BI Pixie adds calculated tables and measures to the semantic model. The semantic model must have the same name as the report and both must be in the same workspace. If this is the first time you add the survey, you will need to refresh the schema of your semantic model after you add the Pixies.
Reports that use a live connection to an external semantic model cannot have surveys added unless the external model already contains the required survey tables from a previous setup.
Important Notes
- To change survey settings on reports that already have Pixies, update the settings, save, and then use Update Pixies on the affected reports.
Related Resources
- Settings — Configure survey settings and question customizations.
- Add Pixies to Your Reports — Apply your survey settings by updating Pixies.
- Collect User Feedback — Add lightweight feedback controls to your reports.
What's Next
- Set up BI Pixie Dashboard — Install the Power BI app to analyze survey results and NPS scores.