Blog
Latest from BI Pixie
Product updates, feature announcements, and insights on Power BI engagement tracking.
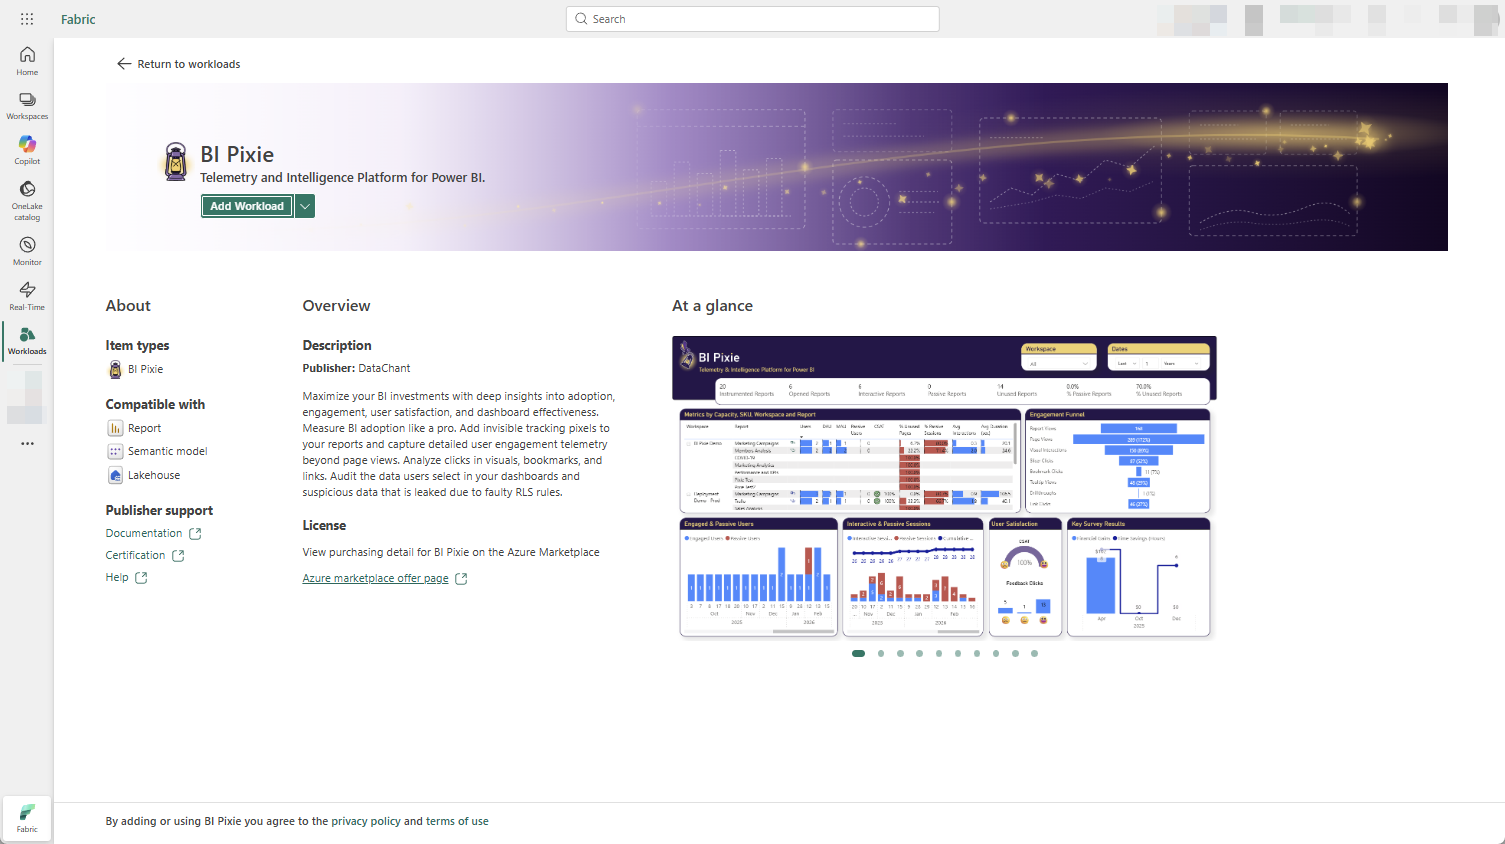
BI Pixie Workload for Microsoft Fabric is Now Generally Available
BI Pixie Workload for Microsoft Fabric is now generally available in the Workload Hub. Any Fabric tenant can add BI Pixie and track how Power BI reports are used, with scalable telemetry processing, Bring Your Own Storage, data residency in your OneLake, and AI assistants.
Read more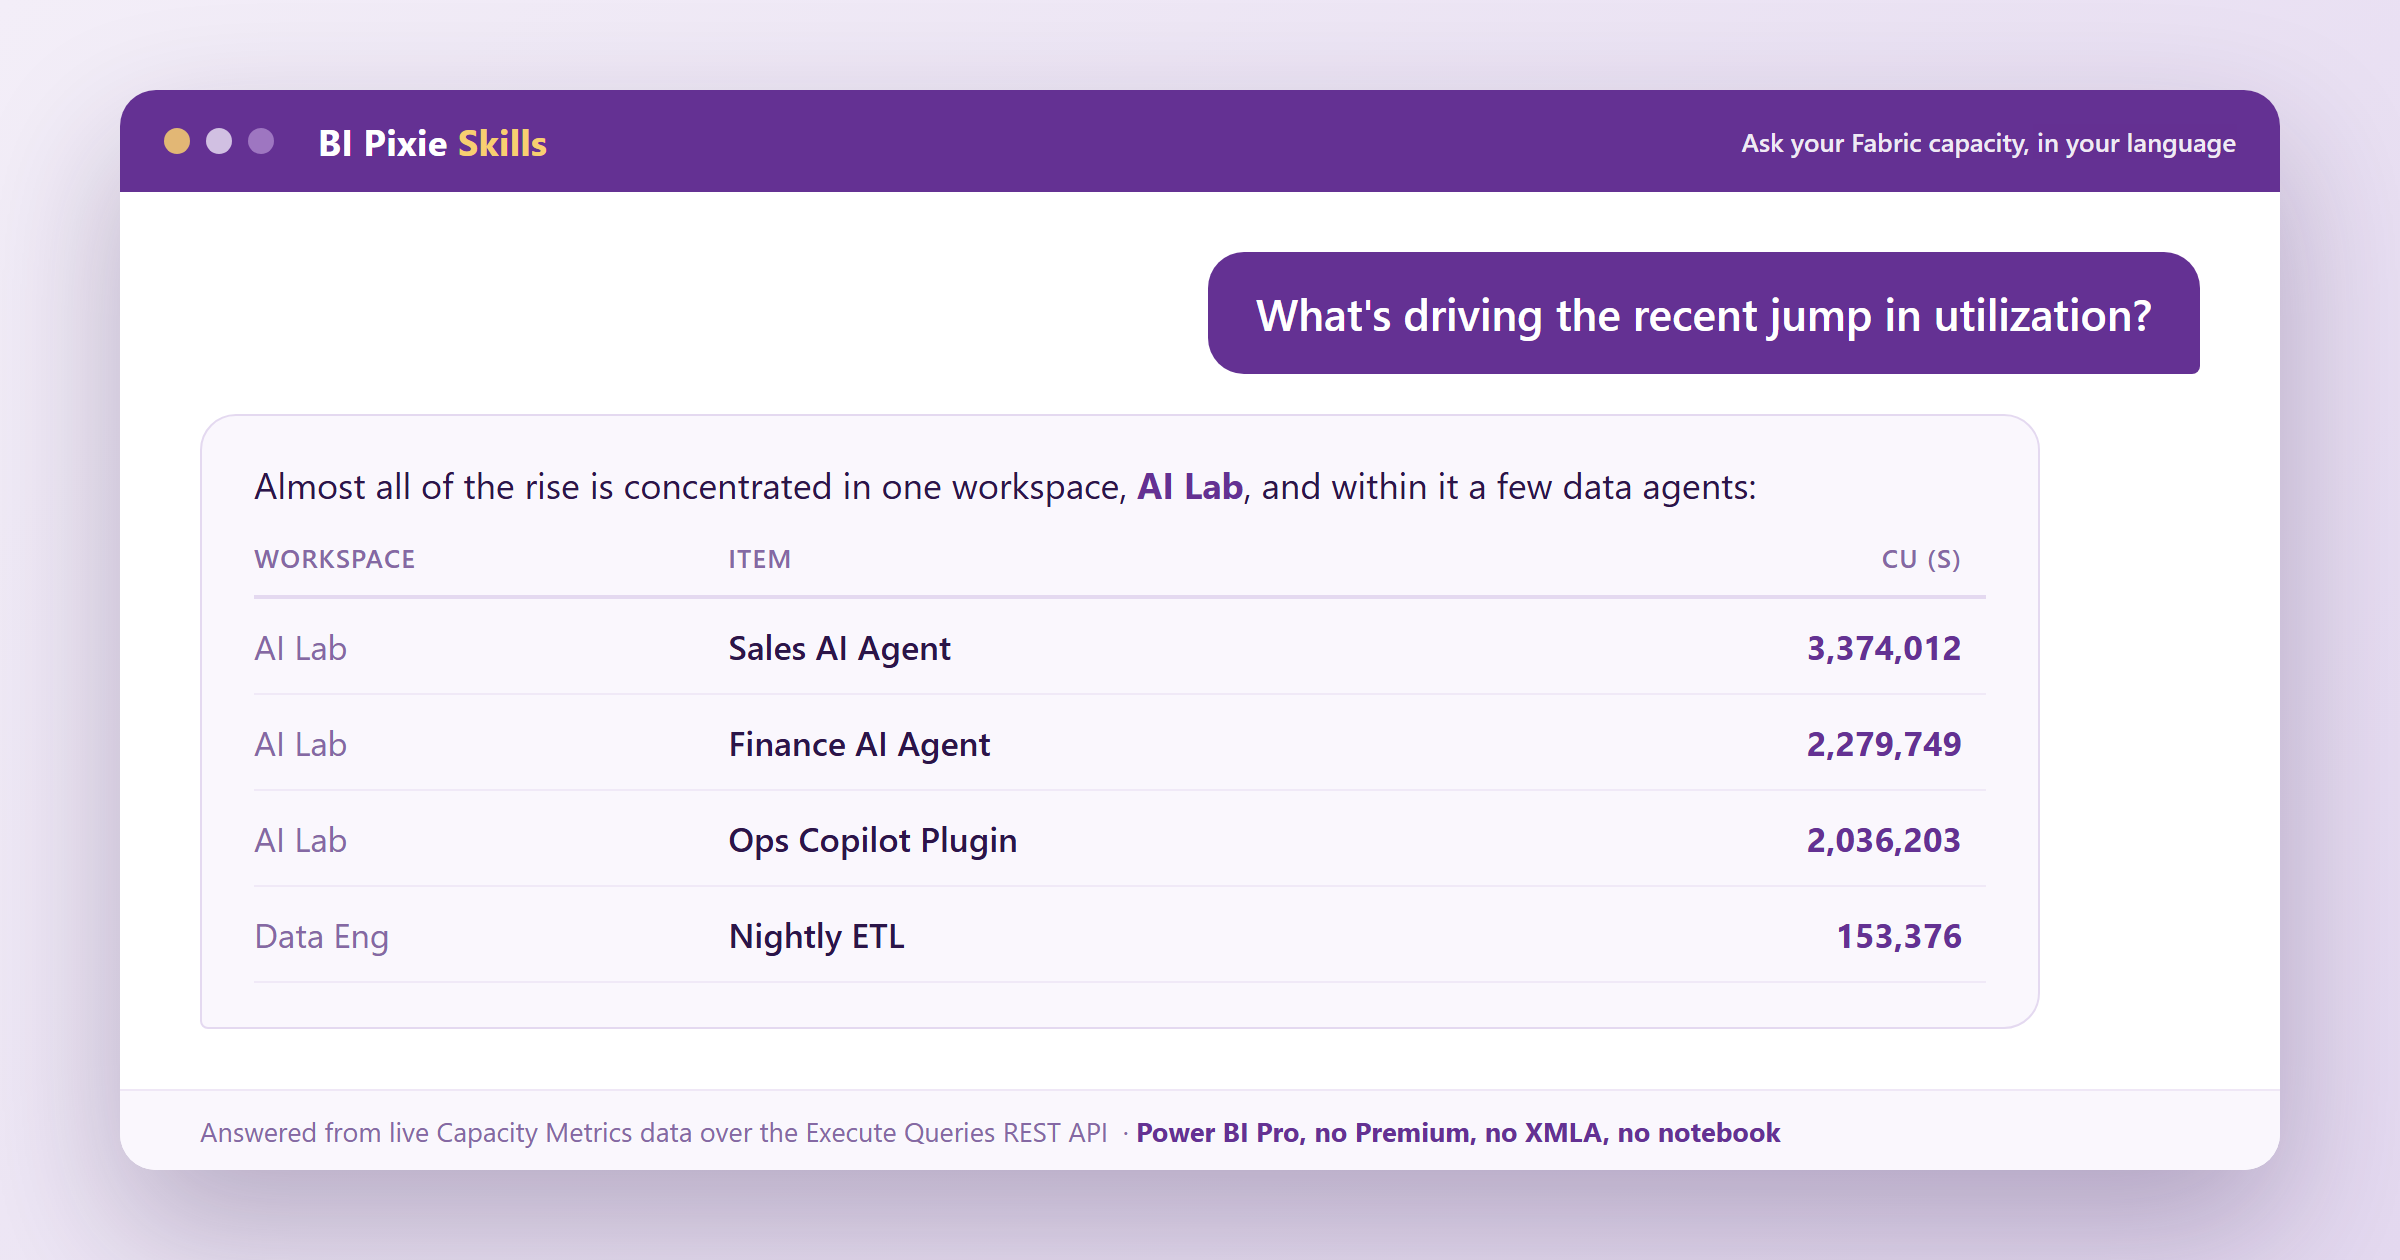
Agentic and Programmatic Fabric Capacity Monitoring Using a Pro License
Capacity monitoring can be easy. Ask your agent what is driving utilization, which operations cost the most CU, and which items are barely used, and get the answers fast, with no extra load on your capacity.
Read more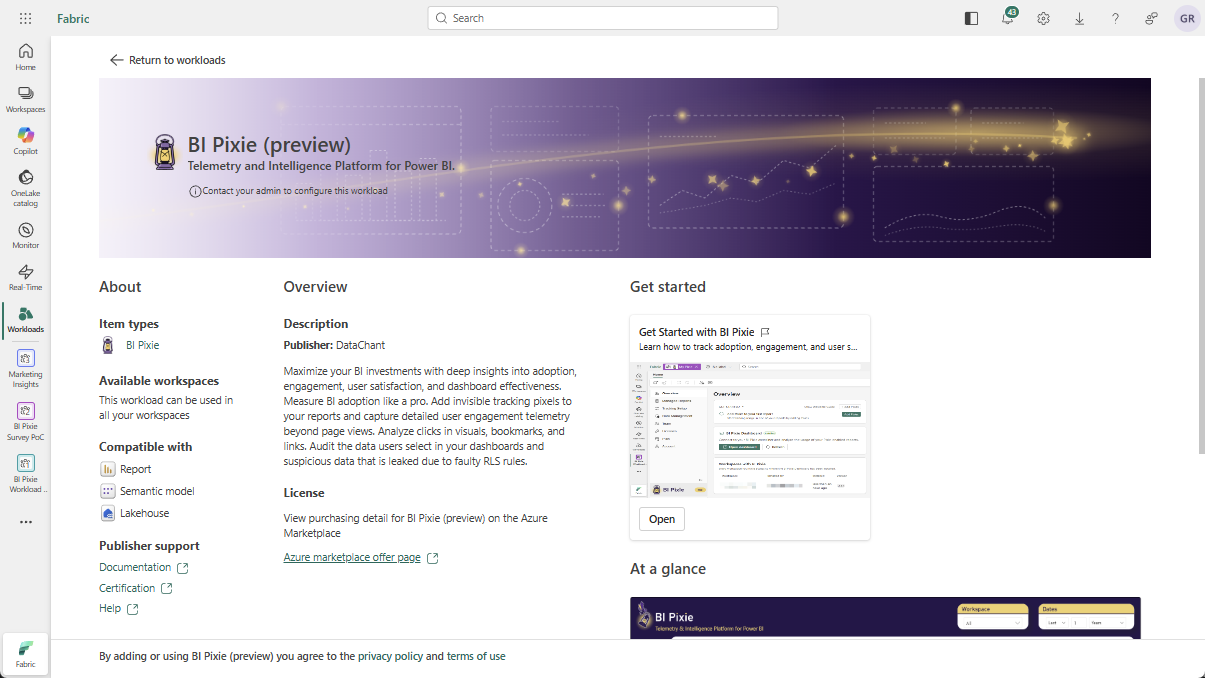
BI Pixie Workload for Microsoft Fabric: Now in Public Preview
BI Pixie Workload is now live in the Microsoft Fabric Workload Hub as a public preview. Every Fabric tenant can add BI Pixie directly from the Workload Hub, with no access request needed, and track how Power BI reports are really used without leaving Fabric.
Read more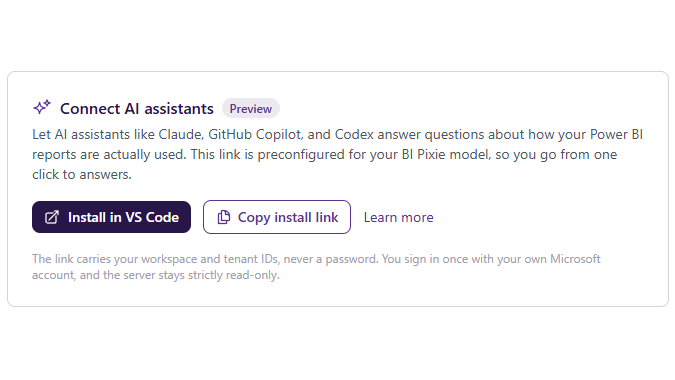
Ask Your Power BI Usage Anything: The BI Pixie MCP Server is in Public Preview
Connect Claude, Copilot, Fabric data agents, and Azure AI Foundry to your BI Pixie data and ask how your Power BI reports are really used, in plain language. The BI Pixie MCP Server is now in public preview, with both a local install and a hosted option.
Read more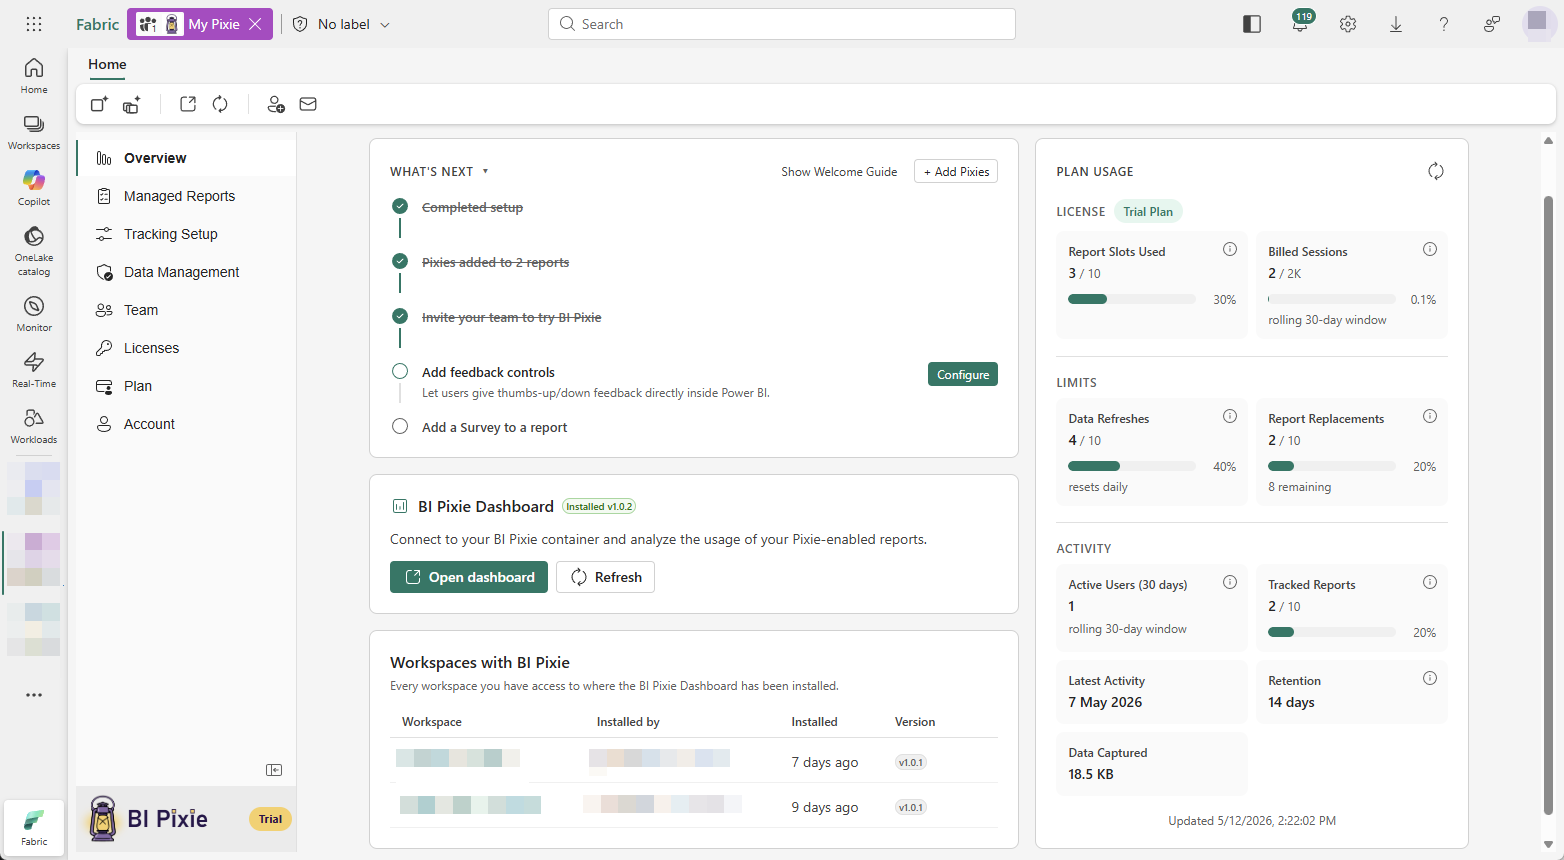
BI Pixie Workload for Microsoft Fabric: Now in Private Preview
BI Pixie now runs natively inside Microsoft Fabric as a workload. A BI Pixie item lives right in your Fabric workspace, so you can track how your Power BI reports are used without leaving Fabric. Now in private preview, with a public preview coming soon.
Read more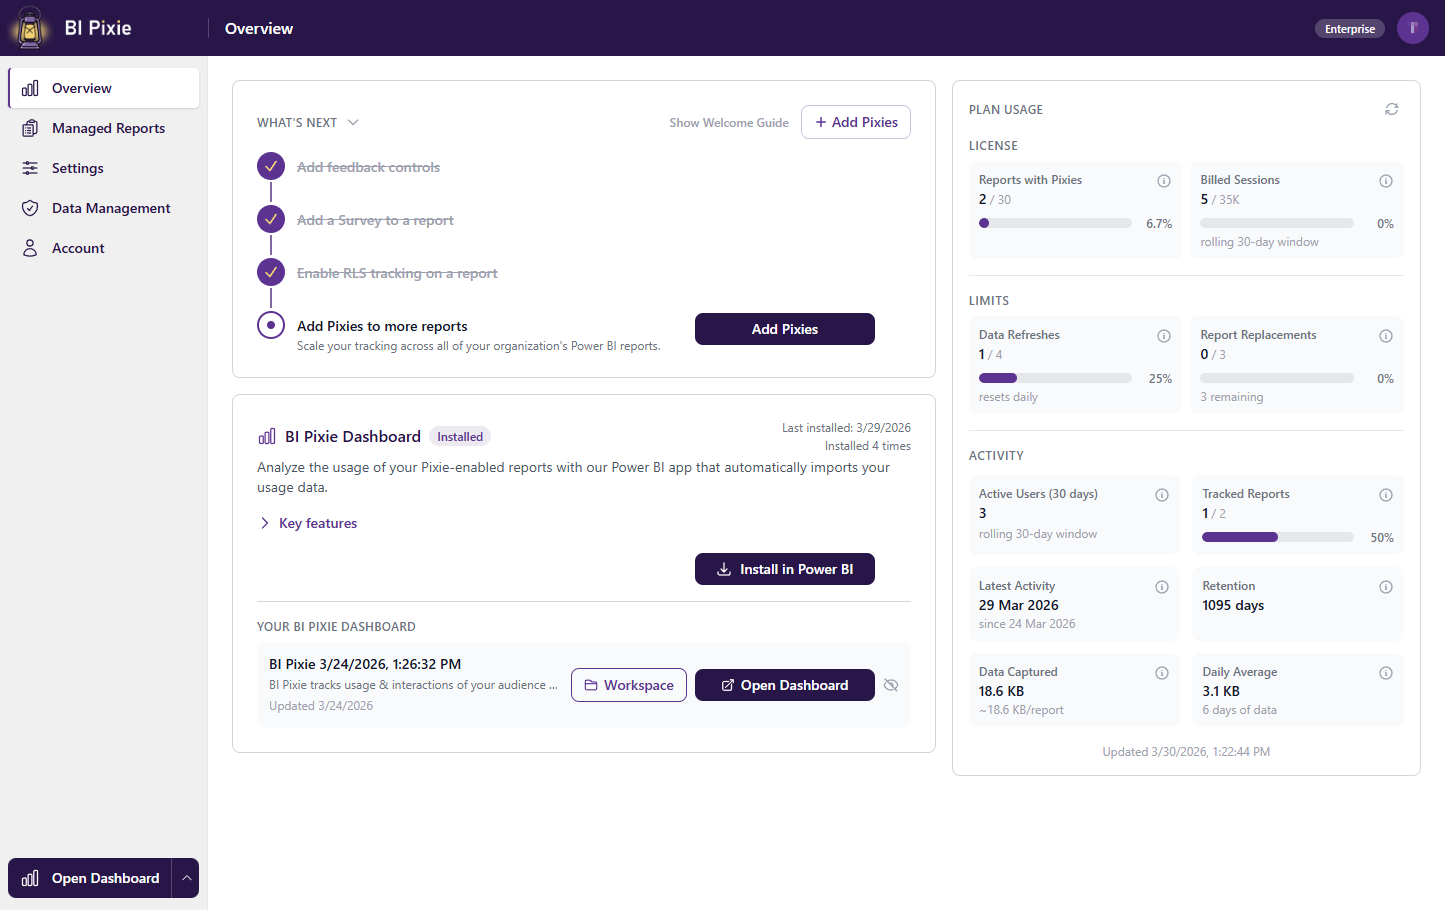
Introducing BI Pixie Cloud
BI Pixie is now available as a cloud service. Sign up, connect your Power BI workspaces, and start tracking user engagement in minutes. No setup or infrastructure required.
Read more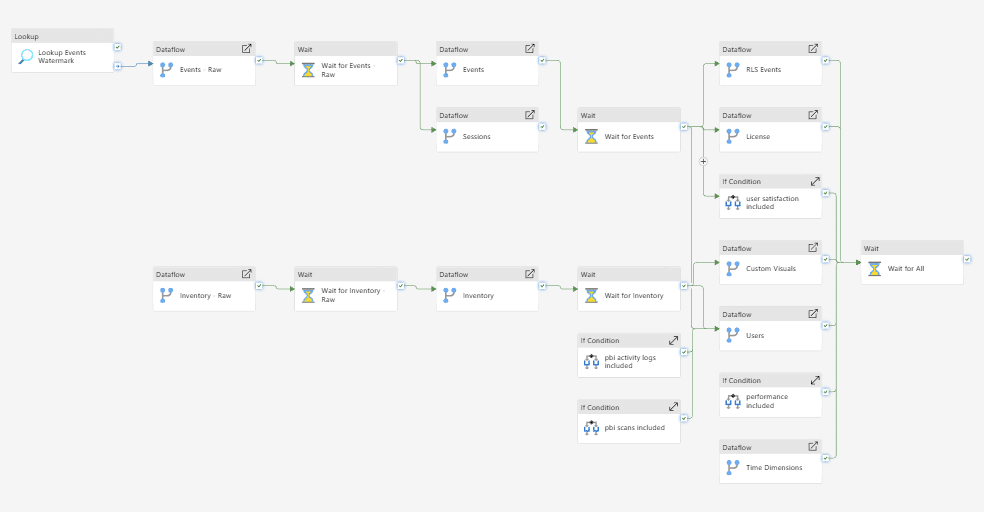
How We Deploy BI Pixie Dashboard Across Customers Using Fabric Dataflows
How we migrated BI Pixie Dashboard from a single PBIX file to a Fabric Lakehouse architecture, and the CI/CD tricks we use to deploy 20 dataflows across customer workspaces with zero item IDs to manage.
Read more
How to Differentiate Between Passive and Active Power BI Users
Not all Power BI users are equal. Learn how BI Pixie distinguishes between passive viewers who glance at reports and active users who click, filter, and explore — and why this distinction matters for measuring real adoption.
Read more
Instrument Power BI Reports via Microsoft Fabric API
BI Pixie now supports instrumenting your Power BI reports through the Microsoft Fabric REST API — no manual PBIX editing, no Git repository required. Connect, select your reports, and start tracking in minutes.
Read more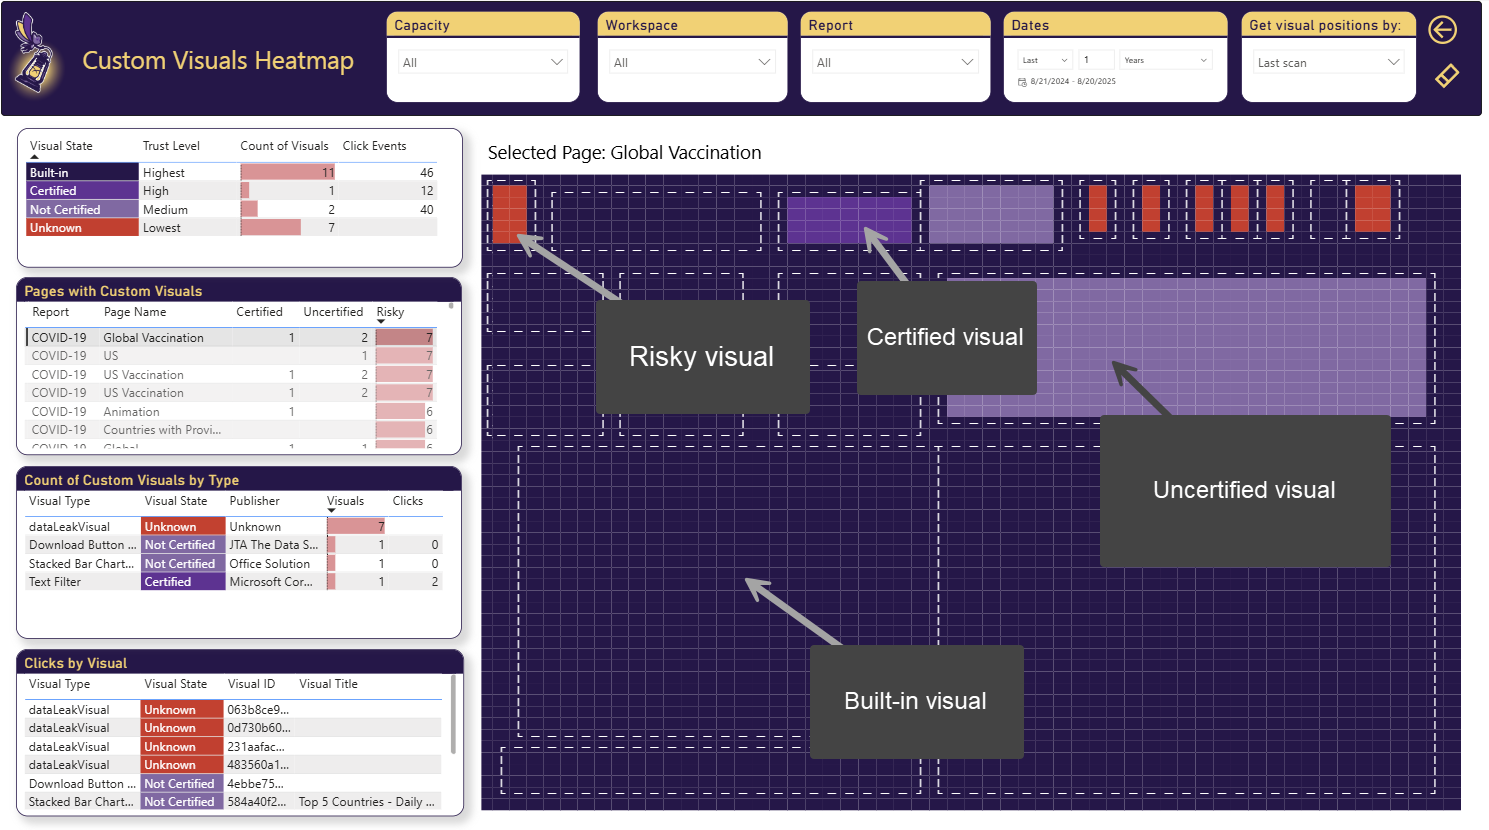
Analyze Custom Visuals' Engagement, Performance and Risks
BI Pixie now tracks custom visual usage across your Power BI tenant. Identify which custom visuals drive engagement, which ones slow down reports, and which introduce governance risks.
Read more
Detect Data Leakage Due to Flaws in RLS Implementation
Row-Level Security in Power BI is only as strong as its implementation. BI Pixie's new RLS auditing feature detects when users access data they should not see, helping you identify and fix security gaps before they become breaches.
Read more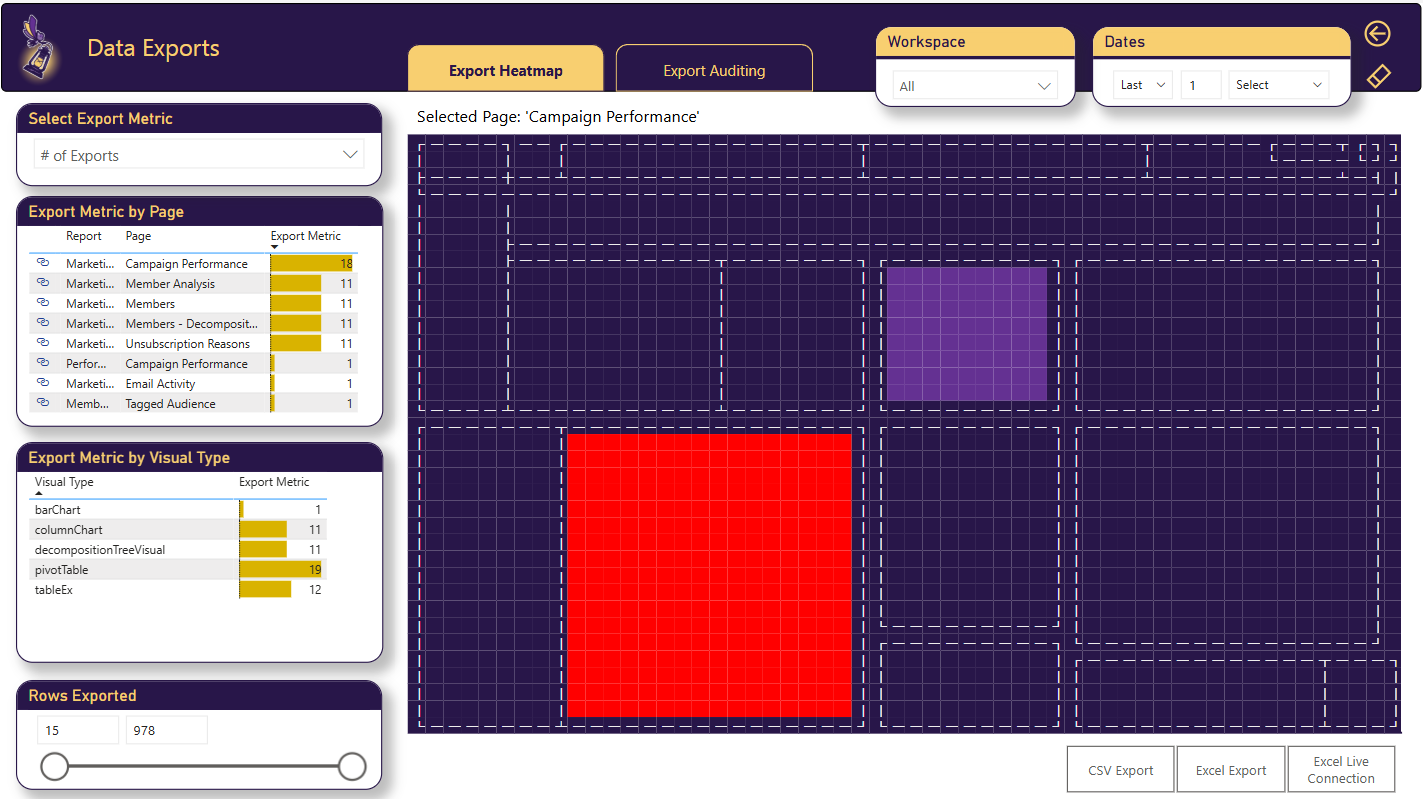
Gain Insights on Export to Excel/CSV Events in Power BI
Track when users export data from your Power BI reports to Excel or CSV. Understand export patterns, identify heavily exported reports, and monitor potential data exfiltration risks.
Read more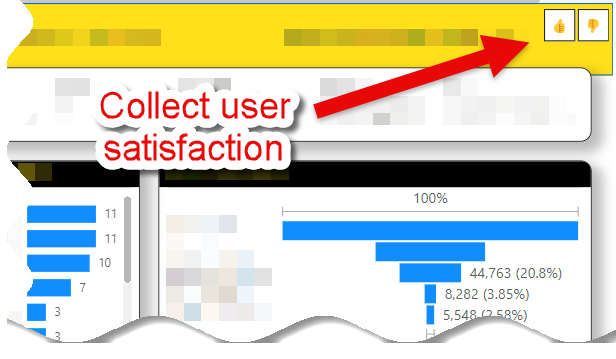
Embedded Surveys in Power BI
Collect user feedback directly inside your Power BI reports with BI Pixie's embedded surveys. Measure satisfaction, gather feature requests, and quantify business impact — without leaving the report experience.
Read more
Measuring the Effectiveness of Your Power BI Dashboards
Watch Gil Raviv's Power BI Summit 2025 session on measuring dashboard effectiveness using visual-level engagement tracking, heatmaps, and user satisfaction surveys with BI Pixie.
Read more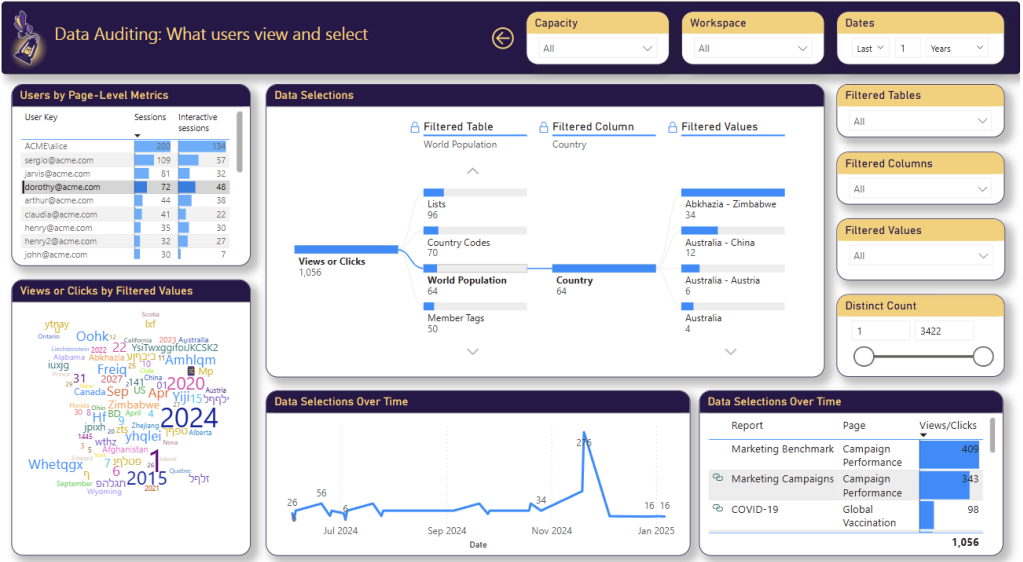
Data Auditing in Power BI
BI Pixie introduces comprehensive data auditing for Power BI — track who accesses which data, when, and how. Build a complete audit trail for compliance, governance, and security requirements.
Read more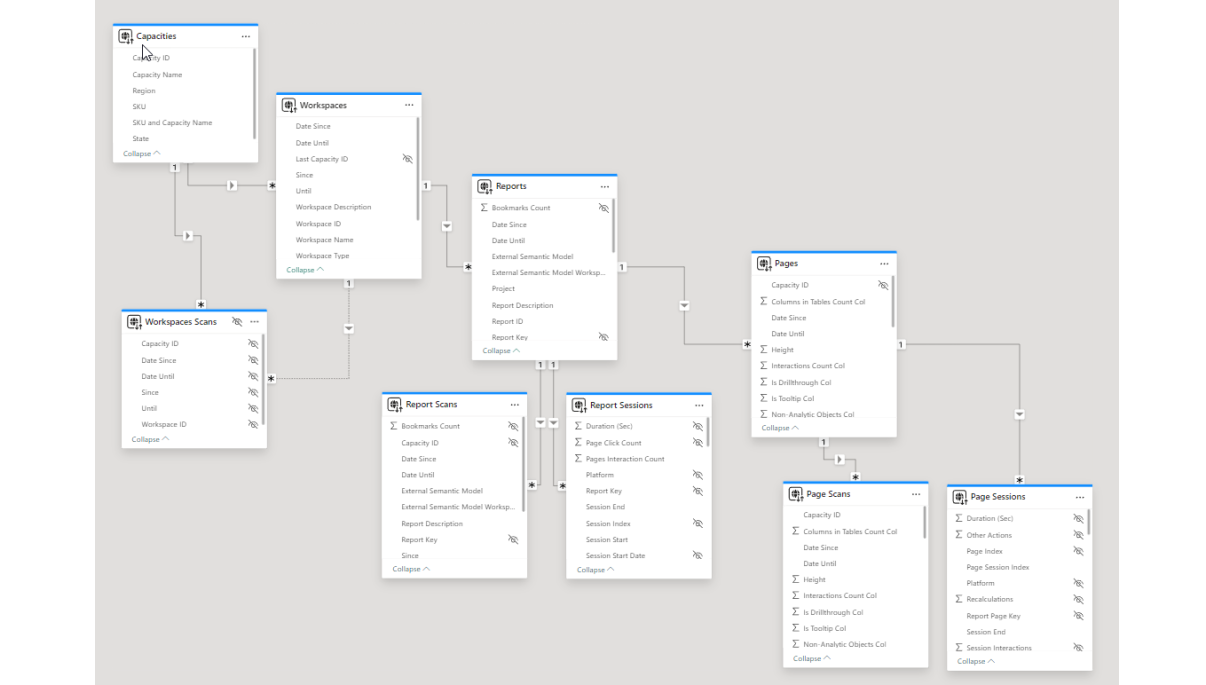
Analyze Engagement at the Capacity and Workspace Levels
BI Pixie now provides engagement analytics at the capacity and workspace levels, giving administrators a top-down view of Power BI adoption and usage patterns across their organization.
Read more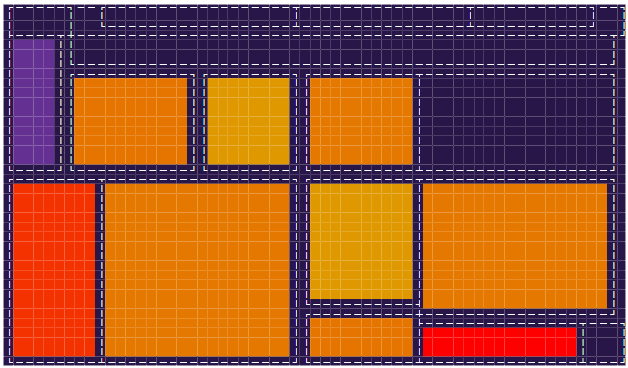
Analyzing Clicks in Power BI Visuals Using a Heatmap
BI Pixie's heatmap feature visualizes user click patterns across your Power BI report pages. See exactly where users engage, identify overlooked visuals, and optimize your report layout based on real interaction data.
Read more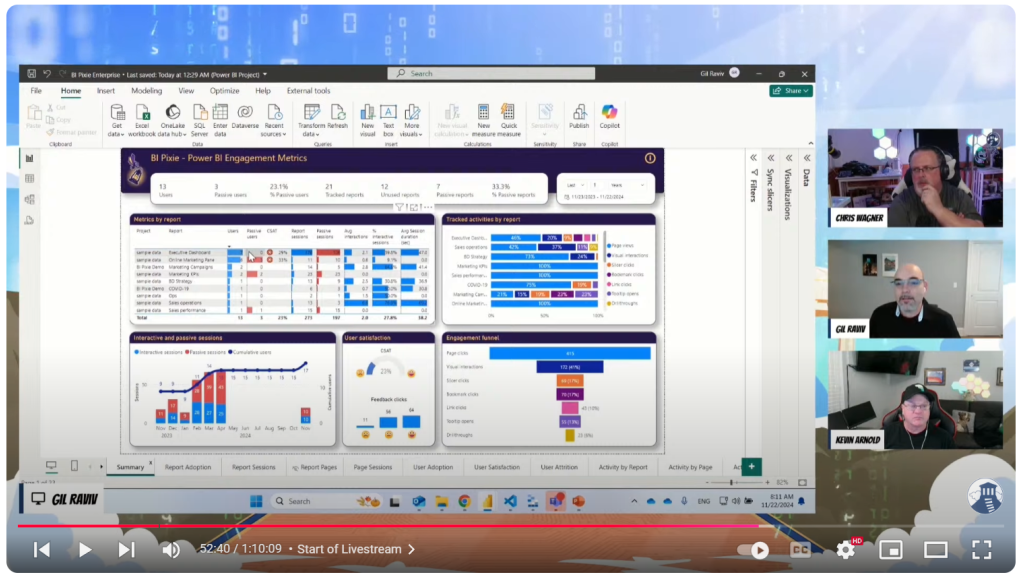
BI Pixie Live on Fabric Fridays
Watch BI Pixie's live demo on the Fabric Fridays community show, where Gil Raviv demonstrates how to track Power BI user engagement with visual-level click tracking, heatmaps, and embedded surveys.
Read more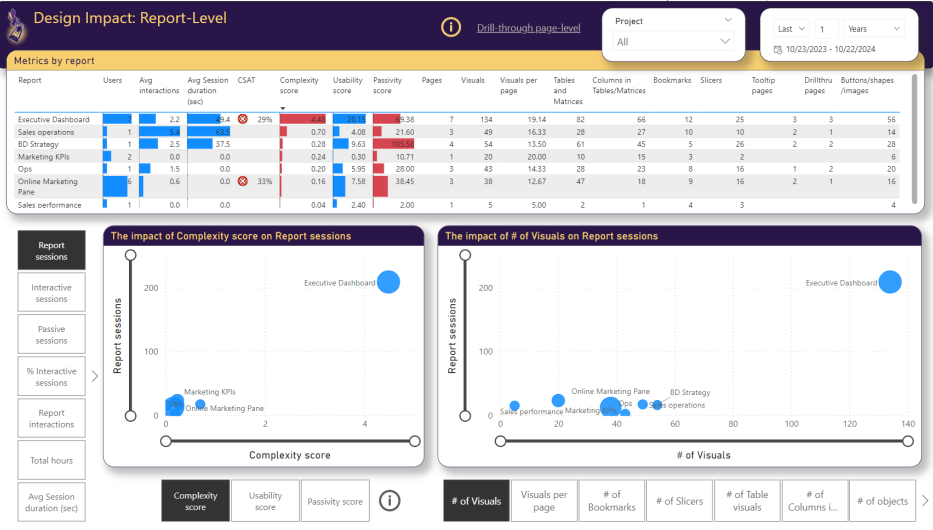
How Do Design Choices in Power BI Impact User Engagement?
Explore how report layout, visual selection, color schemes, and interactivity options in Power BI directly influence user engagement. Learn to make data-driven design decisions using BI Pixie's analytics.
Read more Collect User Feedback in Your Power BI Reports
Learn how to embed feedback collection directly in your Power BI reports using BI Pixie. Capture user satisfaction scores, feature requests, and improvement suggestions without disrupting the report experience.
Read more