
BI Pixie Workload for Microsoft Fabric is Now Generally Available
BI Pixie Workload for Microsoft Fabric is now generally available in the Workload Hub. Any Fabric tenant can add BI Pixie and track how Power BI reports are used, with scalable telemetry processing, Bring Your Own Storage, data residency in your OneLake, and AI assistants.
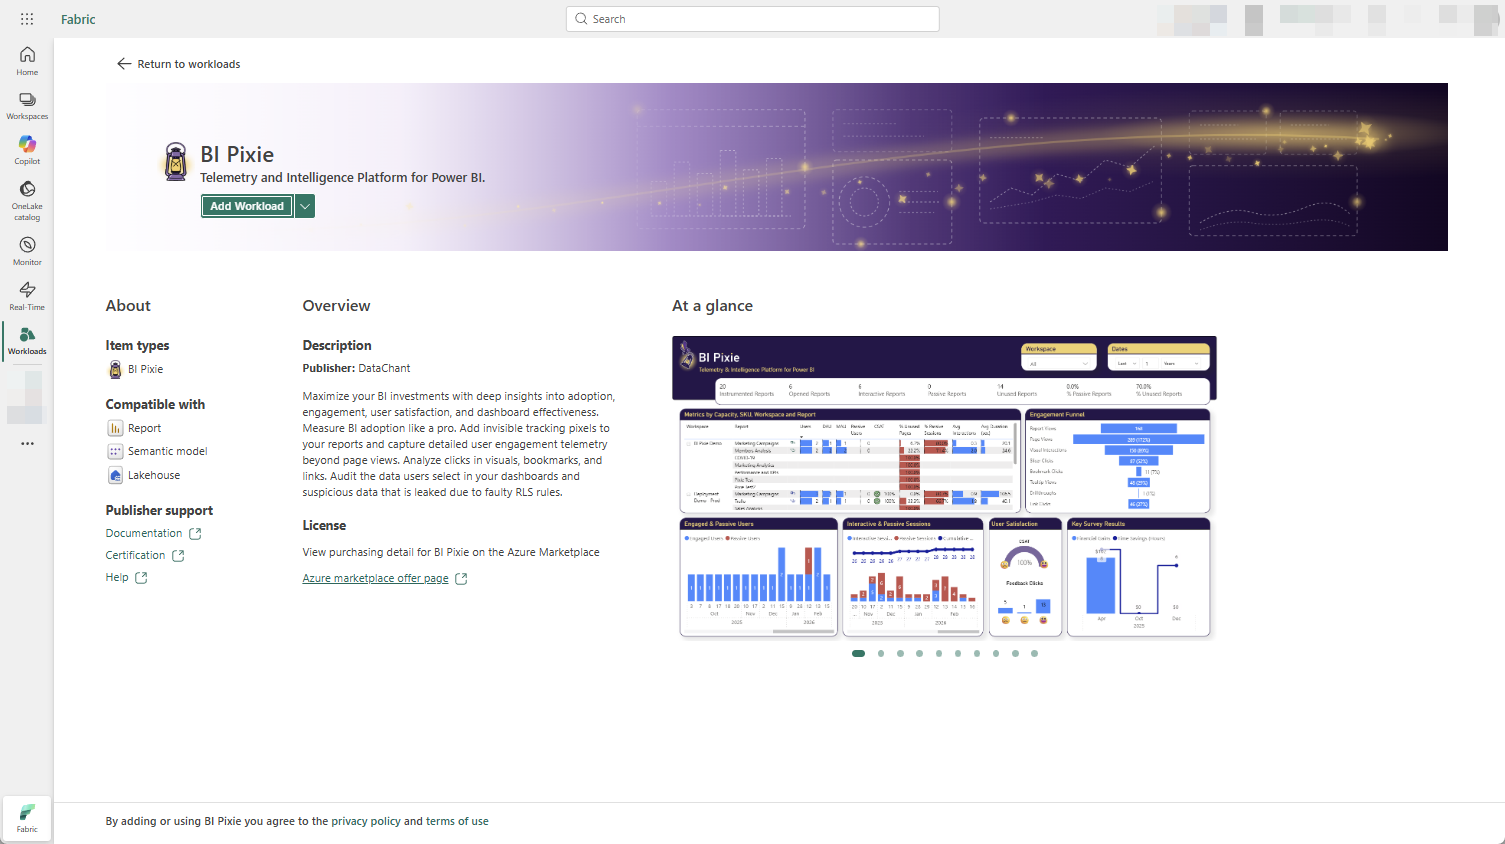
Last month we announced the public preview of BI Pixie running natively inside Microsoft Fabric. Today we are taking the final step.
BI Pixie Workload for Microsoft Fabric is now generally available in the Fabric Workload Hub, having met Microsoft’s workload publishing requirements for GA. Any Fabric tenant can add BI Pixie directly from the BI Pixie page in the Workload Hub and start tracking how Power BI reports are actually used without leaving Fabric.
Four ways to run BI Pixie
BI Pixie meets you wherever your Power BI runs. This GA is about the Fabric option; the others are just as first-class.
- BI Pixie Workload in Microsoft Fabric (now GA). For teams on Fabric: a native workload, added from the Workload Hub, with nothing to deploy.
- BI Pixie Cloud. For Power BI users who want to start in minutes: a hosted service with no infrastructure to set up.
- BI Pixie Self-Hosted. For enterprises that need BI Pixie in their own Azure subscription or Power Platform environment, with full control over data residency and networking.
- Workload with Bring Your Own Storage (BYOS). For enterprises that want the Fabric Workload experience while keeping raw telemetry in storage accounts they own, ideal across multiple business units.
A first-class Fabric workload
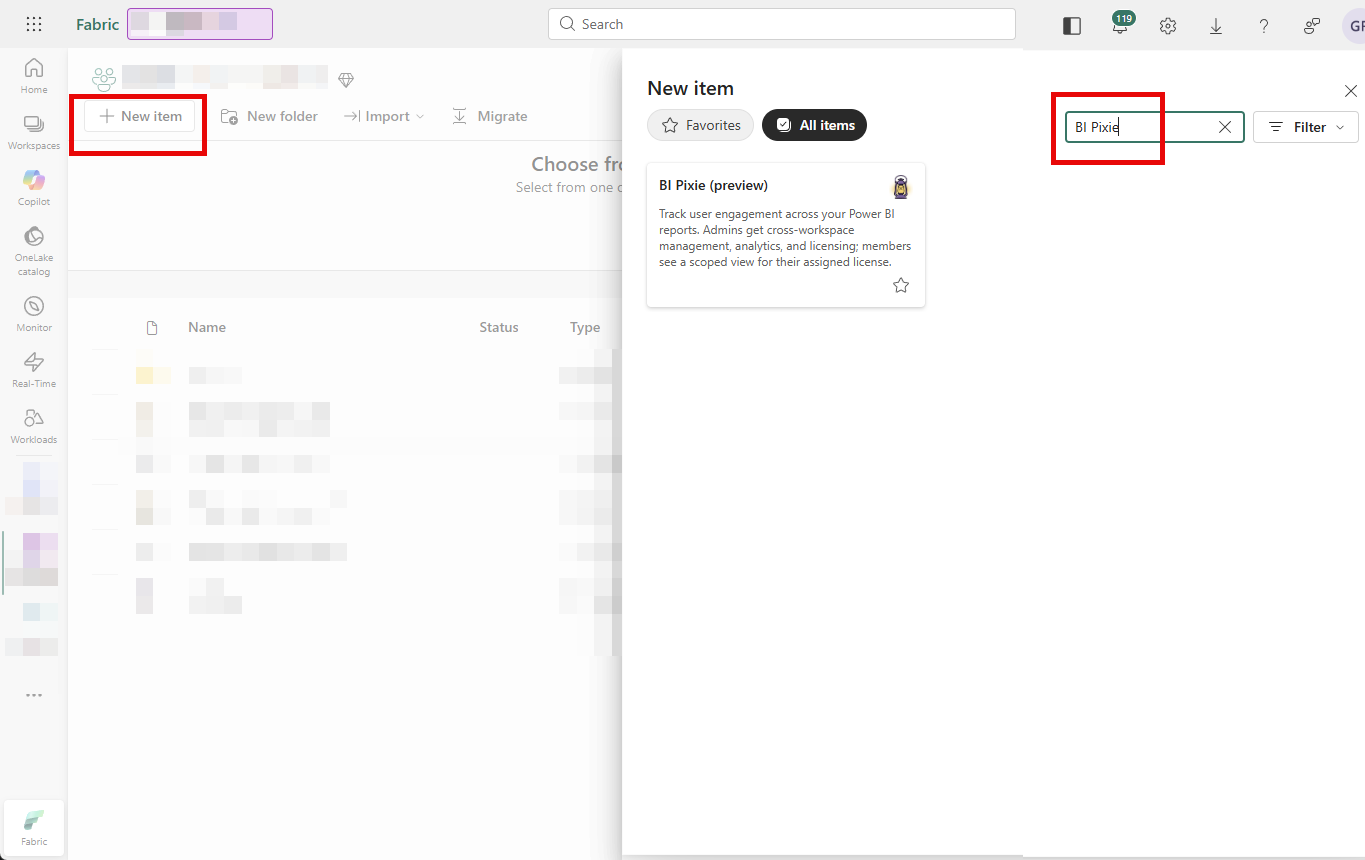
Run this way, BI Pixie is a native Fabric item that lives in your workspace, right next to your lakehouses, semantic models, and reports. There is nothing separate to log into: no portal to manage, no infrastructure to deploy, and no separate user directory to maintain. Once a tenant admin adds BI Pixie from the Workload Hub, anyone in the tenant can create a BI Pixie item straight from the workspace + New menu.
Because it runs inside Fabric, BI Pixie inherits the platform you already trust. Access is governed by your Fabric workspace roles, so the people who can edit a report are the people who can track it. And the BI Pixie Dashboard is set up automatically in the same workspace, so you are analyzing adoption and engagement within minutes of adding your first Pixies.
What’s new at GA
The public preview brought the full engagement experience (managed reports, the BI Pixie Dashboard, embedded surveys, and RLS auditing) into Fabric. GA adds the capabilities that make BI Pixie ready to adopt across your organization.
Scalable telemetry processing
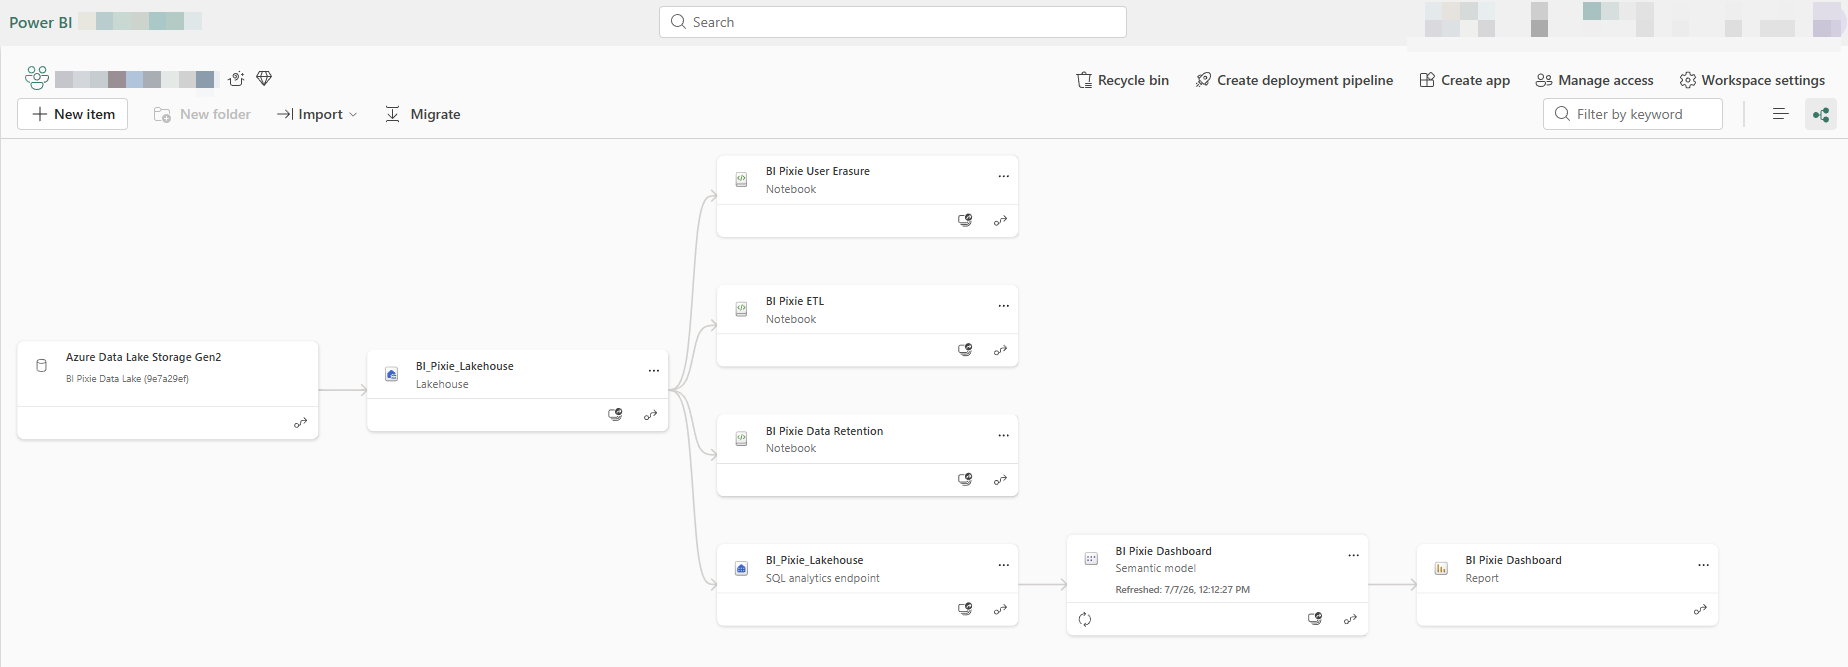
Popular reports can generate a lot of engagement events, and that volume has to be turned into the numbers behind your BI Pixie Dashboard quickly and affordably. Earlier releases loaded the data with an import-mode refresh, which reprocessed everything on each run and did not scale as telemetry grew. GA moves this to a Fabric notebook that runs on your own capacity, processing your engagement data incrementally so it keeps up with high volumes at a fraction of the cost. The result is the same dashboard you already know, refreshed faster and ready to grow with your organization. The same notebook approach powers the customer-run maintenance notebooks that you run under your own identity for data retention and user erasure. Learn more about BI Pixie notebooks.
Data residency in your OneLake
By default, your raw engagement events are stored in a dedicated, secured container in the BI Pixie cloud, in your capacity’s region. Your BI Pixie item reaches that data through a shortcut in your BI Pixie Lakehouse, and the daily BI Pixie ETL run loads new events into your dashboard tables. Your processed dashboard data always lives in your own Fabric workspace.
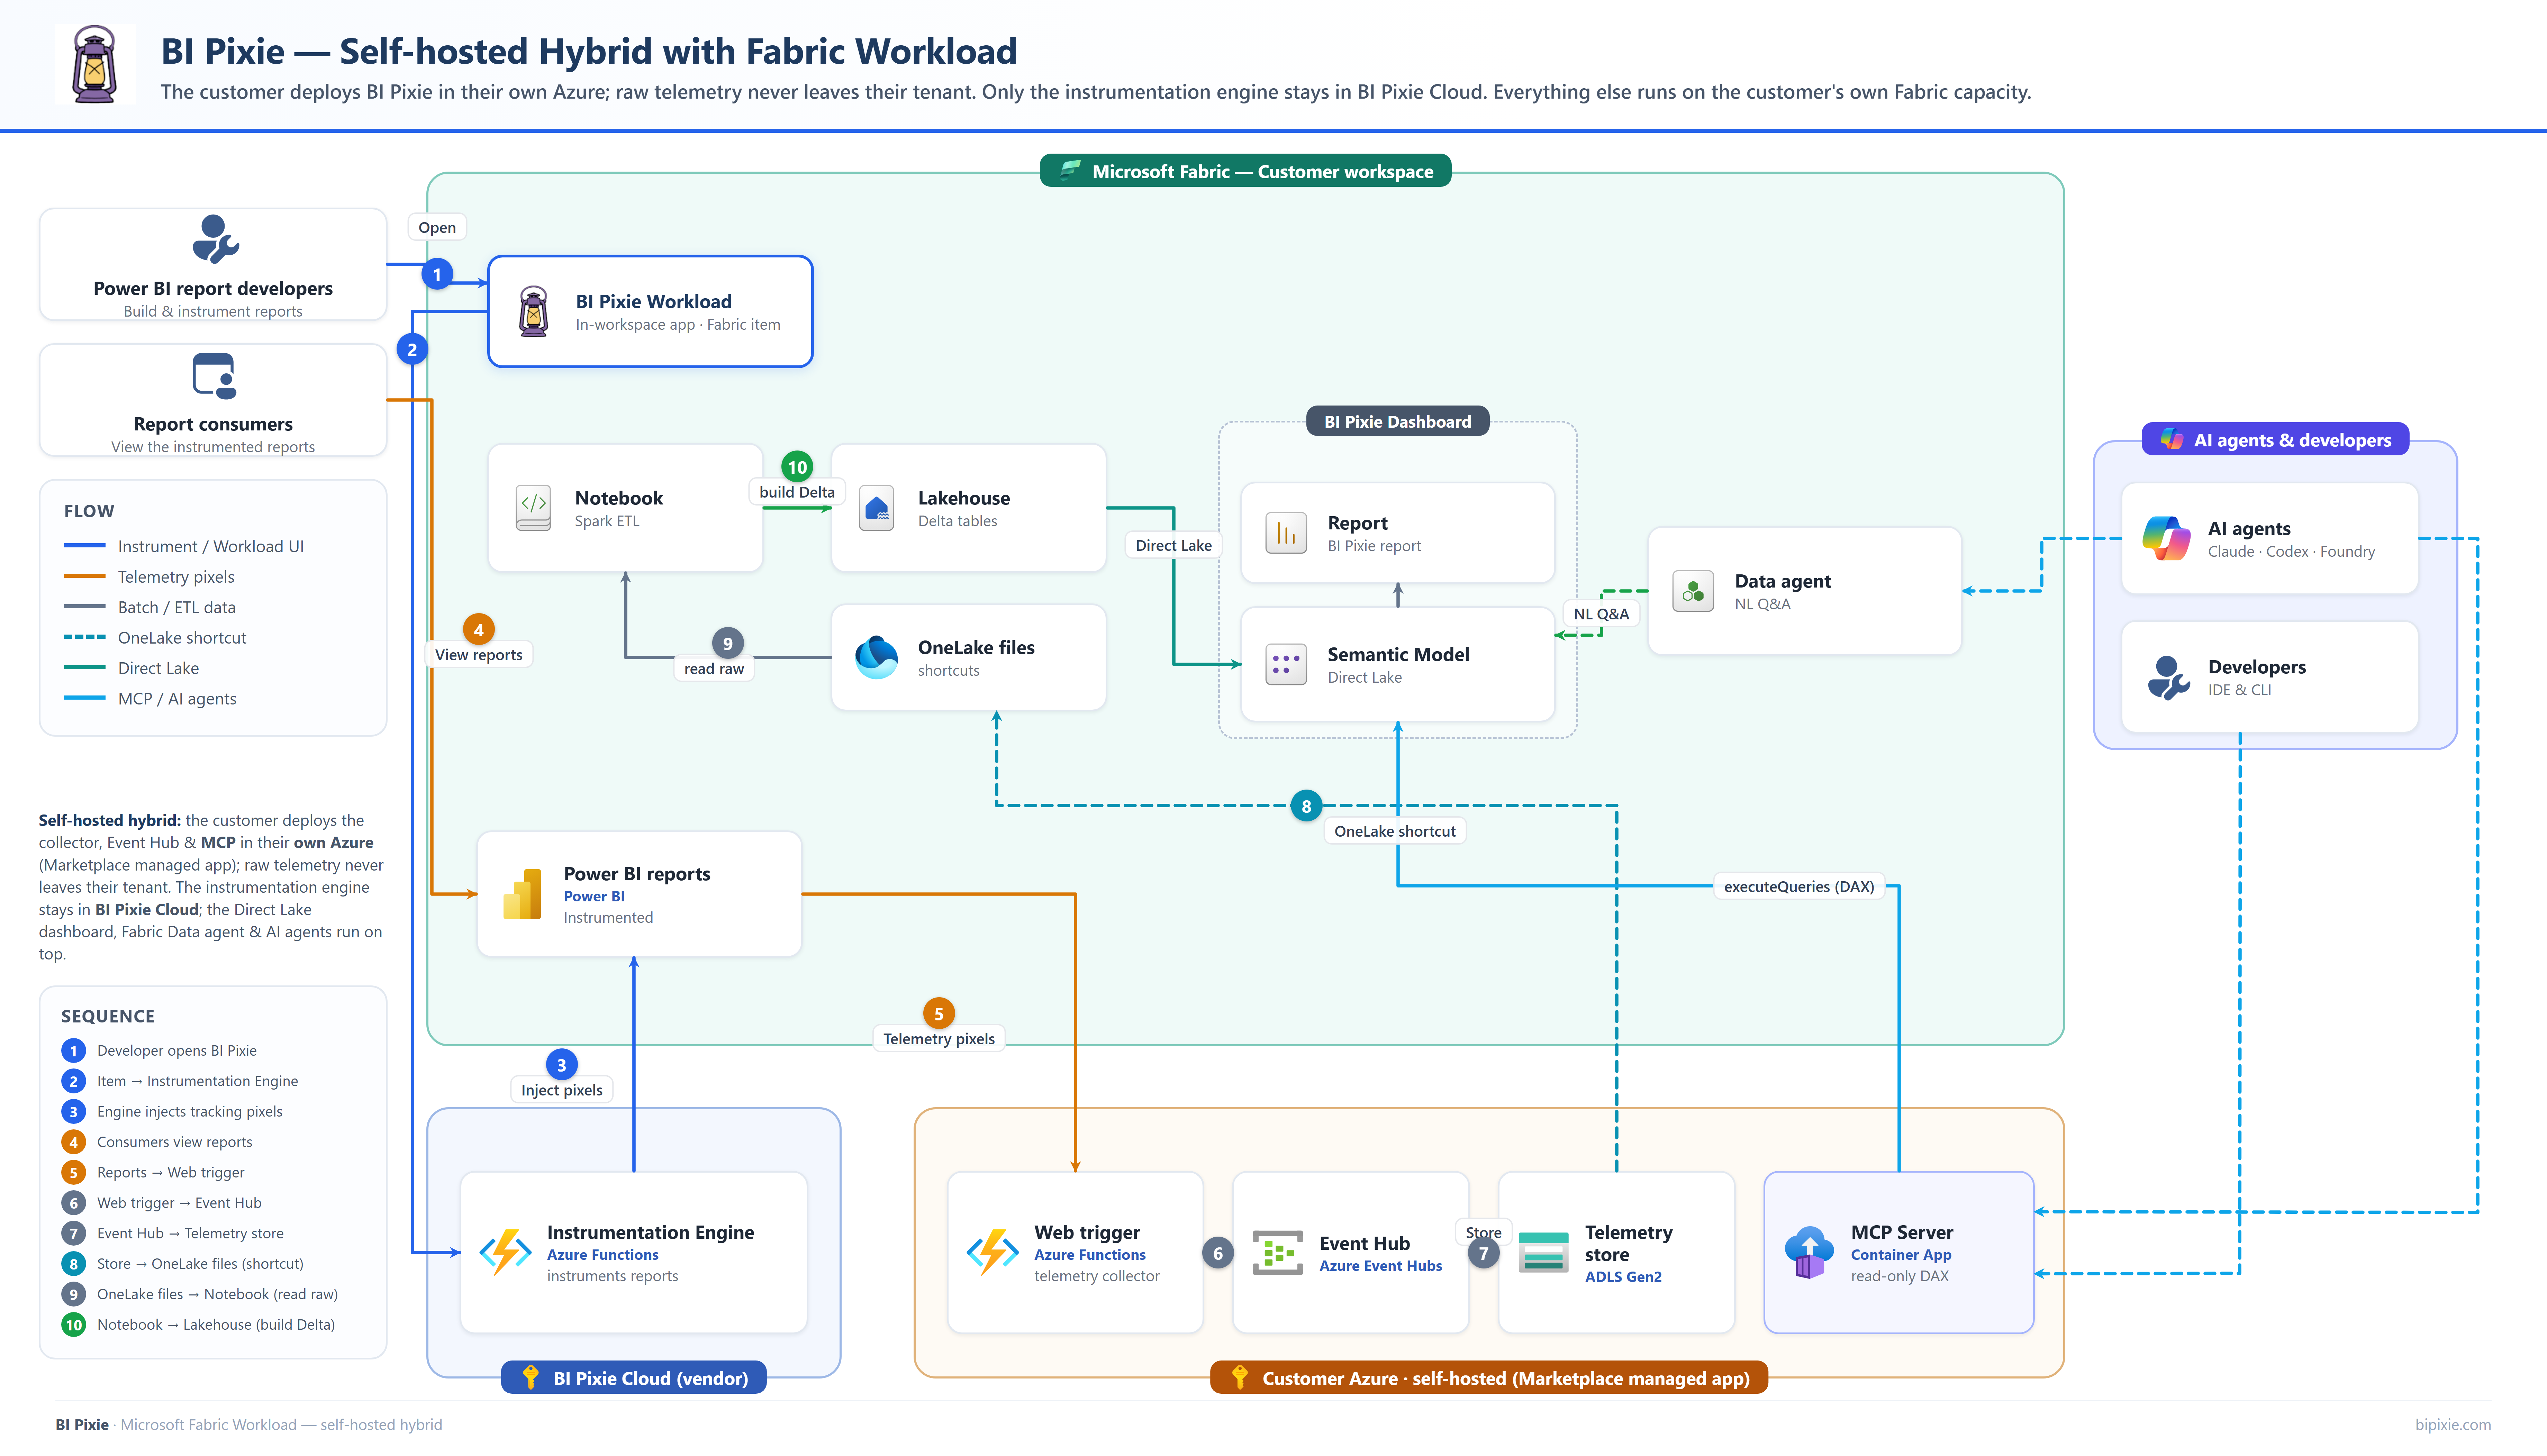
With Data residency, the raw events move to your tenant too. The BI Pixie cloud still collects the engagement events from your users, but instead of keeping them, it pushes each new event to a Lakehouse in your own Microsoft OneLake. Nothing is retained in the BI Pixie cloud. This keeps your telemetry inside your Fabric tenant, governed by your own capacity and tenant policies, which is what teams with data-sovereignty or regulatory requirements need. You can switch it on or off at any time. Read more.
Bring Your Own Storage (BYOS)
BYOS, an Enterprise capability, takes this one step further: you host the BI Pixie telemetry collector yourself, in your own Azure subscription, so events go straight into an Azure Data Lake Storage Gen2 account you own and never touch BI Pixie infrastructure at all. You keep the full Workload experience to manage reports, add Pixies, and install the dashboard, while your raw telemetry stays entirely within storage you control.
AI assistants
Engagement data is only as valuable as the questions you can ask of it. AI Assistants let people and agents explore report engagement, adoption, and user satisfaction in plain language, grounded in the same data as your BI Pixie Dashboard, through two options:
- Fabric Data Agent: a native, zero-install chat agent for everyone in your workspace. Ask in plain language inside Microsoft Fabric and Microsoft 365 Copilot.
- BI Pixie MCP Server: connect your own AI tools (Claude, GitHub Copilot, Codex, Azure AI Foundry) for exact, repeatable, programmatic access.
But the bigger opportunity is what BI Pixie brings to every agent you already run. When a data agent turns a question into a query against a large model, it has to guess which table, column, and value the user means, and that guesswork is where agents go wrong. BI Pixie removes the guesswork by grounding your agents in how people actually use your reports. It knows which fields users filter on most, which values they select, and which reports and pages carry the business, so your agents resolve ambiguity the way your users would and focus on the data that matters most to the people reading the dashboards. Point a Fabric Data Agent or your own MCP client at your BI Pixie model, and it answers not just from your data, but from your organization’s real behavior.
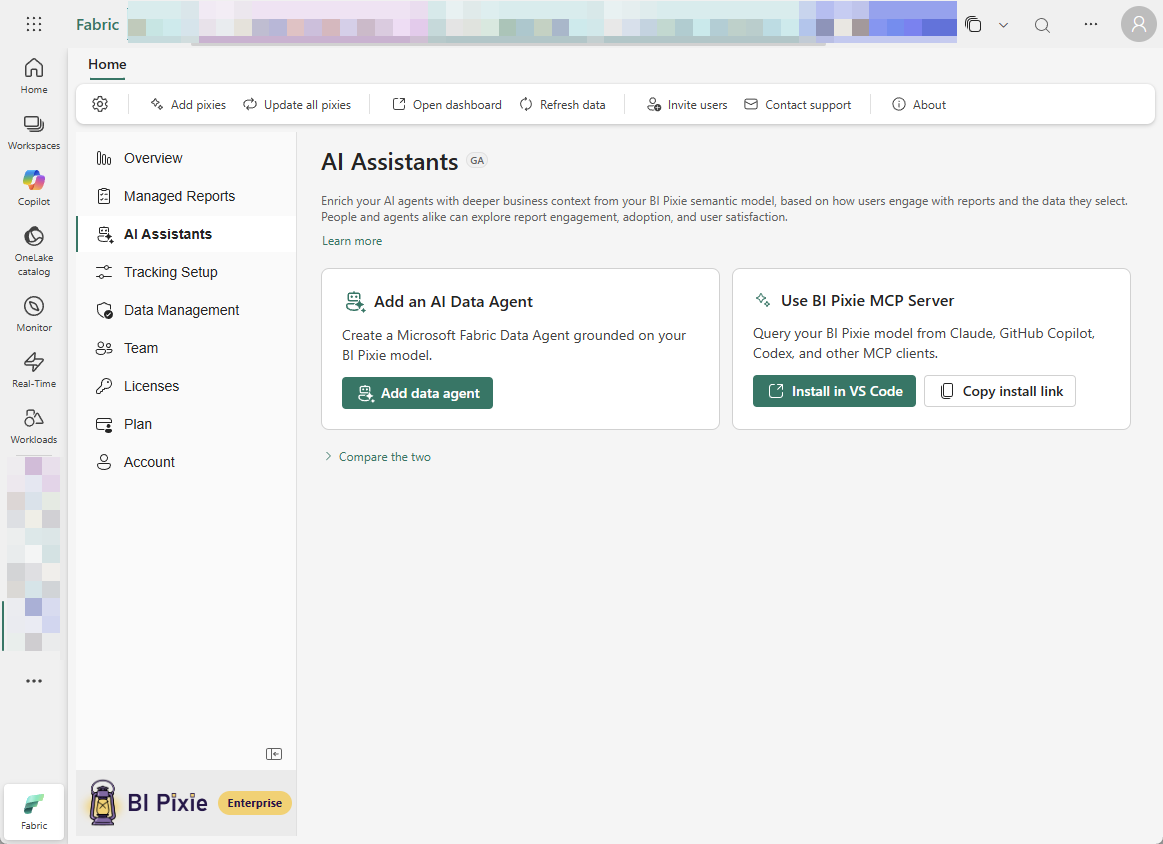
The BI Pixie MCP Server is generally available too. Instead of writing DAX or exporting tables, you ask which reports are unused and could be retired? what is my stickiness? which pages get the most clicks? The answers come straight from your BI Pixie semantic model, match your BI Pixie Dashboard exactly, and the server is strictly read-only.
Start free
Start free on Microsoft Fabric: one tracked report, one tracked semantic model, one free AI Readiness score for each semantic model, for up to 500, and community docs and MCP access. No credit card required. When you are ready to grow, a single BI Pixie subscription (through the Azure Marketplace or the BI Pixie subscription portal) covers every BI Pixie item across your tenant. And on the Enterprise plan, you can divide that one subscription into isolated licenses for separate business units or cost centers, each with its own tracked items, data isolation, and chargeback.
Get started in five minutes
- Tenant admins: add BI Pixie from the Workload Hub. The Add BI Pixie to Your Tenant guide walks through the tenant setting, distribution scope, and verification.
- Report owners: create a BI Pixie item, add Pixies to a report, and watch the events flow. The Getting Started guide covers your first five minutes.
Open BI Pixie in the Fabric Workload Hub
Prefer Cloud or self-hosted? BI Pixie meets you wherever your Power BI runs. See the deployment options for every way to run it.