
BI Pixie Workload for Microsoft Fabric User Guide
BI Pixie is a telemetry and AI Readiness platform for Power BI, available natively inside Microsoft Fabric. It works on three assets in your estate: your reports, your semantic models, and your Fabric data agents.
Your reports get Pixies, invisible tracking pixels native to Power BI. Pixies are tiny, native Power BI visuals and hidden measures, and through them BI Pixie captures how your audience uses each report, including page views, visual clicks, filter selections, bookmark navigation, tooltip views, drill-through actions, surveys, and feedback responses. Tracking is invisible to end users. BI Pixie collects viewer user names only when you turn on Capture user identity, and until then it counts viewers by a masked IP address. When you turn it on, you choose on the Account page whether BI Pixie keeps each viewer's email address, a masked ID or nothing.
Your semantic models and your data agents get assessed for AI Readiness: how well prepared they are to answer questions correctly through Copilot and Fabric data agents. Each assessment gives a score from 0 to 100 and a ranked list of what to fix, and BI Pixie applies the fixes you approve. Semantic model scoring is read-only and follows fixed rules, with no AI model judging your semantic model, so a second assessment is a reliable before-and-after check on the changes you make.
To prove the result, a Benchmark asks Copilot, a Fabric data agent, or another AI agent questions whose correct answers are computed from your own data. An A/B test runs the same benchmark on two versions of your semantic model or your AI, and shows whether a change made more answers correct.
The two connect, and that connection is what makes BI Pixie different: when a semantic model's reports are tracked, its AI Readiness score is grounded in what people actually click, which sharpens the score and decides which fixes matter most.
How BI Pixie Works
BI Pixie runs as a workload inside Microsoft Fabric. You work with it through a BI Pixie item that lives in a Fabric workspace, alongside your lakehouses, semantic models, and reports. From the item, you add Pixies to your reports and analyze how they are used, assess and optimize your semantic models and data agents, and run benchmarks and A/B tests. Here is the end-to-end flow:
- A Fabric tenant admin adds BI Pixie: From the BI Pixie page in the Fabric Workload Hub, a tenant admin selects Add to Tenant. Once added, the BI Pixie item type becomes available across the tenant so users can create it in their workspaces. See the Add BI Pixie to Your Tenant page for the admin steps.
- Create a BI Pixie item: In any Fabric workspace, choose + New and pick BI Pixie. The BI Pixie item opens with the workspace context already established by Fabric.
- Add Pixies to your reports: In the Managed Reports view, select Add Pixies, then select reports in the workspace and add Pixies to them. BI Pixie writes the Pixies directly into your report definitions.
- Collect engagement data: As your audience uses the tracked reports, the Pixies stream events to BI Pixie's telemetry pipeline.
- Verify data is flowing: In the Managed Reports view, select a tracked report, then use Check for events in the Events pane below the list to confirm the Pixies are firing.
- Analyze your audience: Use the BI Pixie Dashboard to analyze adoption, engagement, satisfaction, and more.
- Score your semantic models: Open the AI Readiness view and assess one semantic model or many at once. You get an AI Readiness score with a ranked list of what to fix. This needs no Pixies and no waiting, so it is the fastest thing to try in a new item, and it gets sharper once your reports are tracked.
Key Features
| Feature | Description |
|---|---|
| AI Readiness | |
| Semantic model assessments & optimizations | Score your semantic models from 0 to 100 against Microsoft's guidance for Copilot and Fabric data agents, then apply the descriptions, AI Instructions, AI data schema, display folders, and field defaults you approve. |
| Data agents assessments & optimizations | Score your Fabric data agents from 0 to 100 against Microsoft's published guidance, then apply the changes you approve to each data agent's configuration. |
| Benchmarks | Measure how accurately Copilot, a Fabric data agent, or another AI agent answers questions about your semantic model, with correct answers computed live from your own data. |
| A/B tests | Find out whether a change to your semantic model or your AI made more answers correct, by running the same benchmark on both versions. |
| Tracked Events | Track page views, visual clicks, filter selections, bookmark clicks, tooltip views, drill-through actions, and link clicks across all the Power BI reports in your Fabric workspaces. |
| Feedback Controls (Pro) | Add thumbs-up/down or smile/frown feedback buttons to your reports and measure user satisfaction. |
| Embedded Surveys (Pro) | Embed fully customizable surveys directly inside your Power BI reports, including NPS, business value, time-saved, decision-making, issues, and email questions. |
| RLS Auditing | Audit Row-Level Security (RLS) to detect misconfigurations, overexposed data, and potential security risks. |
| Data Management | Search, preview, and delete tracked user data. Configure data retention periods and delete end-user activity records upon request for GDPR compliance. |
| User Adoption and Attrition | Monitor who uses your reports, how often, and identify users who stopped engaging. Distinguish between active users (clicks, slicer selections) and passive users (page views only). |
| Dashboard KPIs | Track key metrics out of the box: active users, engagement rate, sessions, average session duration, pages per session, NPS, satisfaction rate, estimated business value, and estimated time saved. |
| Time Intelligence | Analyze engagement trends over time, track adoption and attrition patterns, and measure the impact of report design changes on user behavior. |
| Custom Analytics | Connect to the BI Pixie semantic model from Power BI Desktop to build your own custom report pages, visuals, and navigation links tailored to your organization's needs. |
| License Assignment (Enterprise) | Licensing for additional business units available: each license in your Enterprise agreement is a separately deployed estate, enabling decentralized tracking across your organization. |
| Per-License Data Isolation (Enterprise) | Each license gets its own isolated storage, ensuring strict data separation between business units or teams. |
| Data Sovereignty (Enterprise) | Telemetry is stored in the same region as your Fabric capacity, helping you meet data residency and regulatory requirements. |
| Workspace Collaboration | Team members with Contributor, Member, or Admin role on the Fabric workspace can open the BI Pixie item and configure tracking, with no separate user management. |
The BI Pixie Item
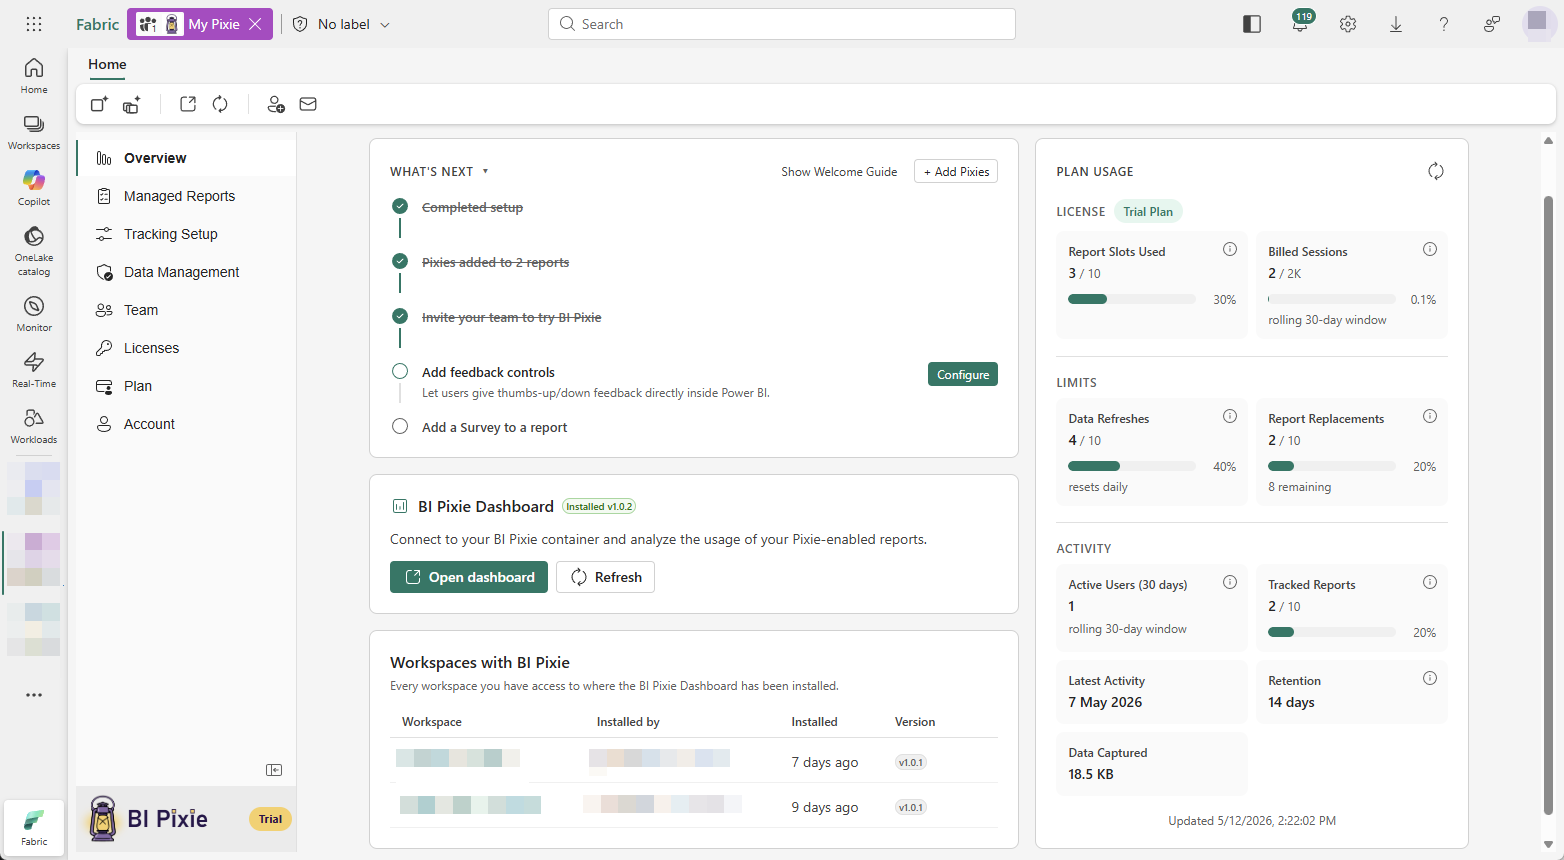
When you open a BI Pixie item in a Fabric workspace, BI Pixie shows a left sidebar. Each sidebar entry opens one view that handles part of the lifecycle:
| View | Purpose |
|---|---|
| Overview | Item overview, getting-started checklist, plan usage, and a one-click link to install the BI Pixie Dashboard. |
| AI Readiness | Score your semantic models for Copilot and for Fabric data agents, apply guided fixes, and run a benchmark to prove the result. |
| Managed Reports | List of all tracked reports in the workspace. Add Pixies, update them, clean, or open the source report in Fabric. Select a report to fill the Events pane below the list, where you can check the most recent events and confirm the Pixies are firing. |
| Schedules | Run AI Readiness assessments automatically, against the semantic models you choose, at the times you set. Schedules are available on the Enterprise plan. |
| AI Assistants | Add a Fabric Data Agent or connect the BI Pixie MCP Server to ask questions about report usage in plain language. |
| Tracking Setup | Configure tracking options, feedback controls, and surveys at the item, workspace, or report level. |
| Data Management | Manage data retention, search end-user data, and delete activity records on request. |
| Architecture | Choose where your engagement data lives, and see how each setup flows end to end. |
| Account | Plan and usage details for the item, on a strip of tabs: Overview, Plan, Usage, Security, AI, Team, and Licenses. Team manages who can open the BI Pixie item. Licenses manages the licenses in an Enterprise agreement, each with its own isolated storage. Everyone can open Account, and only workspace admins can open the Plan, Team, and Licenses tabs. |
The sidebar is always visible, so you can move between views quickly without leaving the BI Pixie item. Some surfaces sit inside a view rather than in the sidebar: the Events pane lives in Managed Reports, and Plan, Team, and Licenses are tabs in Account.
Prerequisites
- A Microsoft Fabric capacity (paid SKU or Fabric trial)
- A Fabric workspace where you have Contributor, Member, or Admin role
- BI Pixie added to your Fabric tenant (see the Add BI Pixie to Your Tenant page for the tenant-admin steps)
- At least one Power BI report in the workspace you want to track
What's Next
- Getting Started, create your first BI Pixie item, add Pixies to a report, and verify events in five minutes.
- Add BI Pixie to Your Tenant, the tenant-admin steps to add BI Pixie to your Fabric tenant.
- Create a BI Pixie item, a walkthrough of creating a BI Pixie item in a workspace.
- AI Readiness, score how ready your semantic models are for AI agents and fix what holds them back.
- Benchmarks, test how accurately an AI answers real questions from your semantic model.
- Schedules, run AI Readiness assessments automatically on the semantic models you choose.