
AI Readiness Dashboard
The AI Readiness dashboard shows your AI Readiness history in one Power BI report, so that you can see how your whole estate is moving, not one semantic model at a time. Use it to:
- Follow the average AI Readiness score of your semantic models month by month.
- Find the findings that affect the most semantic models, and see which ones you have resolved.
- See which optimizations you applied, and how much the next assessment says each one raised the score.
- Compare benchmark accuracy across runs, and read the outcome of every A/B test.
- Share the history with people who use Power BI but not BI Pixie.
The report is named BI Pixie AI Readiness Dashboard. It sits next to the BI Pixie Dashboard report in your Fabric workspace, uses the same semantic model, and is filled by the same data refresh.
Prerequisites
- The BI Pixie Dashboard, installed in a Fabric workspace. See Set up the dashboard.
- A dashboard installed before the AI Readiness report existed needs an update first. The BI Pixie Dashboard card on the item's Overview offers the update, and its notice says that the update adds an AI Readiness report.
- At least one AI Readiness assessment. See Semantic model assessments.
Open the AI Readiness dashboard
- Open your BI Pixie item in Microsoft Fabric.
- Select Open AI Readiness dashboard. The button is in two places: the header of the AI Readiness page, and the AI Readiness card on the item's Overview, after Open AI Readiness.
The dashboard opens on its Overview page in a Fabric tab. You can also open the BI Pixie AI Readiness Dashboard report directly from your Fabric workspace.
BI Pixie shows the button once your dashboard holds the AI Readiness report and a data refresh has finished since the report was added.
Filter by workspace and date
Two filters sit at the top right of every page, and both carry across pages:
- Workspace limits the report to the semantic models and data agents in the workspaces you choose.
- Dates (UTC) limits the report to a date range. It starts at the last 12 months.
Explore the pages
Select a tab at the top of the report to move between its six pages.
Overview
The state of your estate at a glance: Semantic models assessed, Average Score, Ready for AI, Optimizations applied, Benchmark accuracy and Data agents assessed. The charts show the average AI Readiness score by month, with lines at the band thresholds, the number of semantic models in each band, and the optimizations applied by type. The Semantic models table lists each semantic model with its latest score.
The bands are the same as in BI Pixie: Ready for AI at 80 and above, Needs curation from 50 to 79, and Not ready for AI below 50.
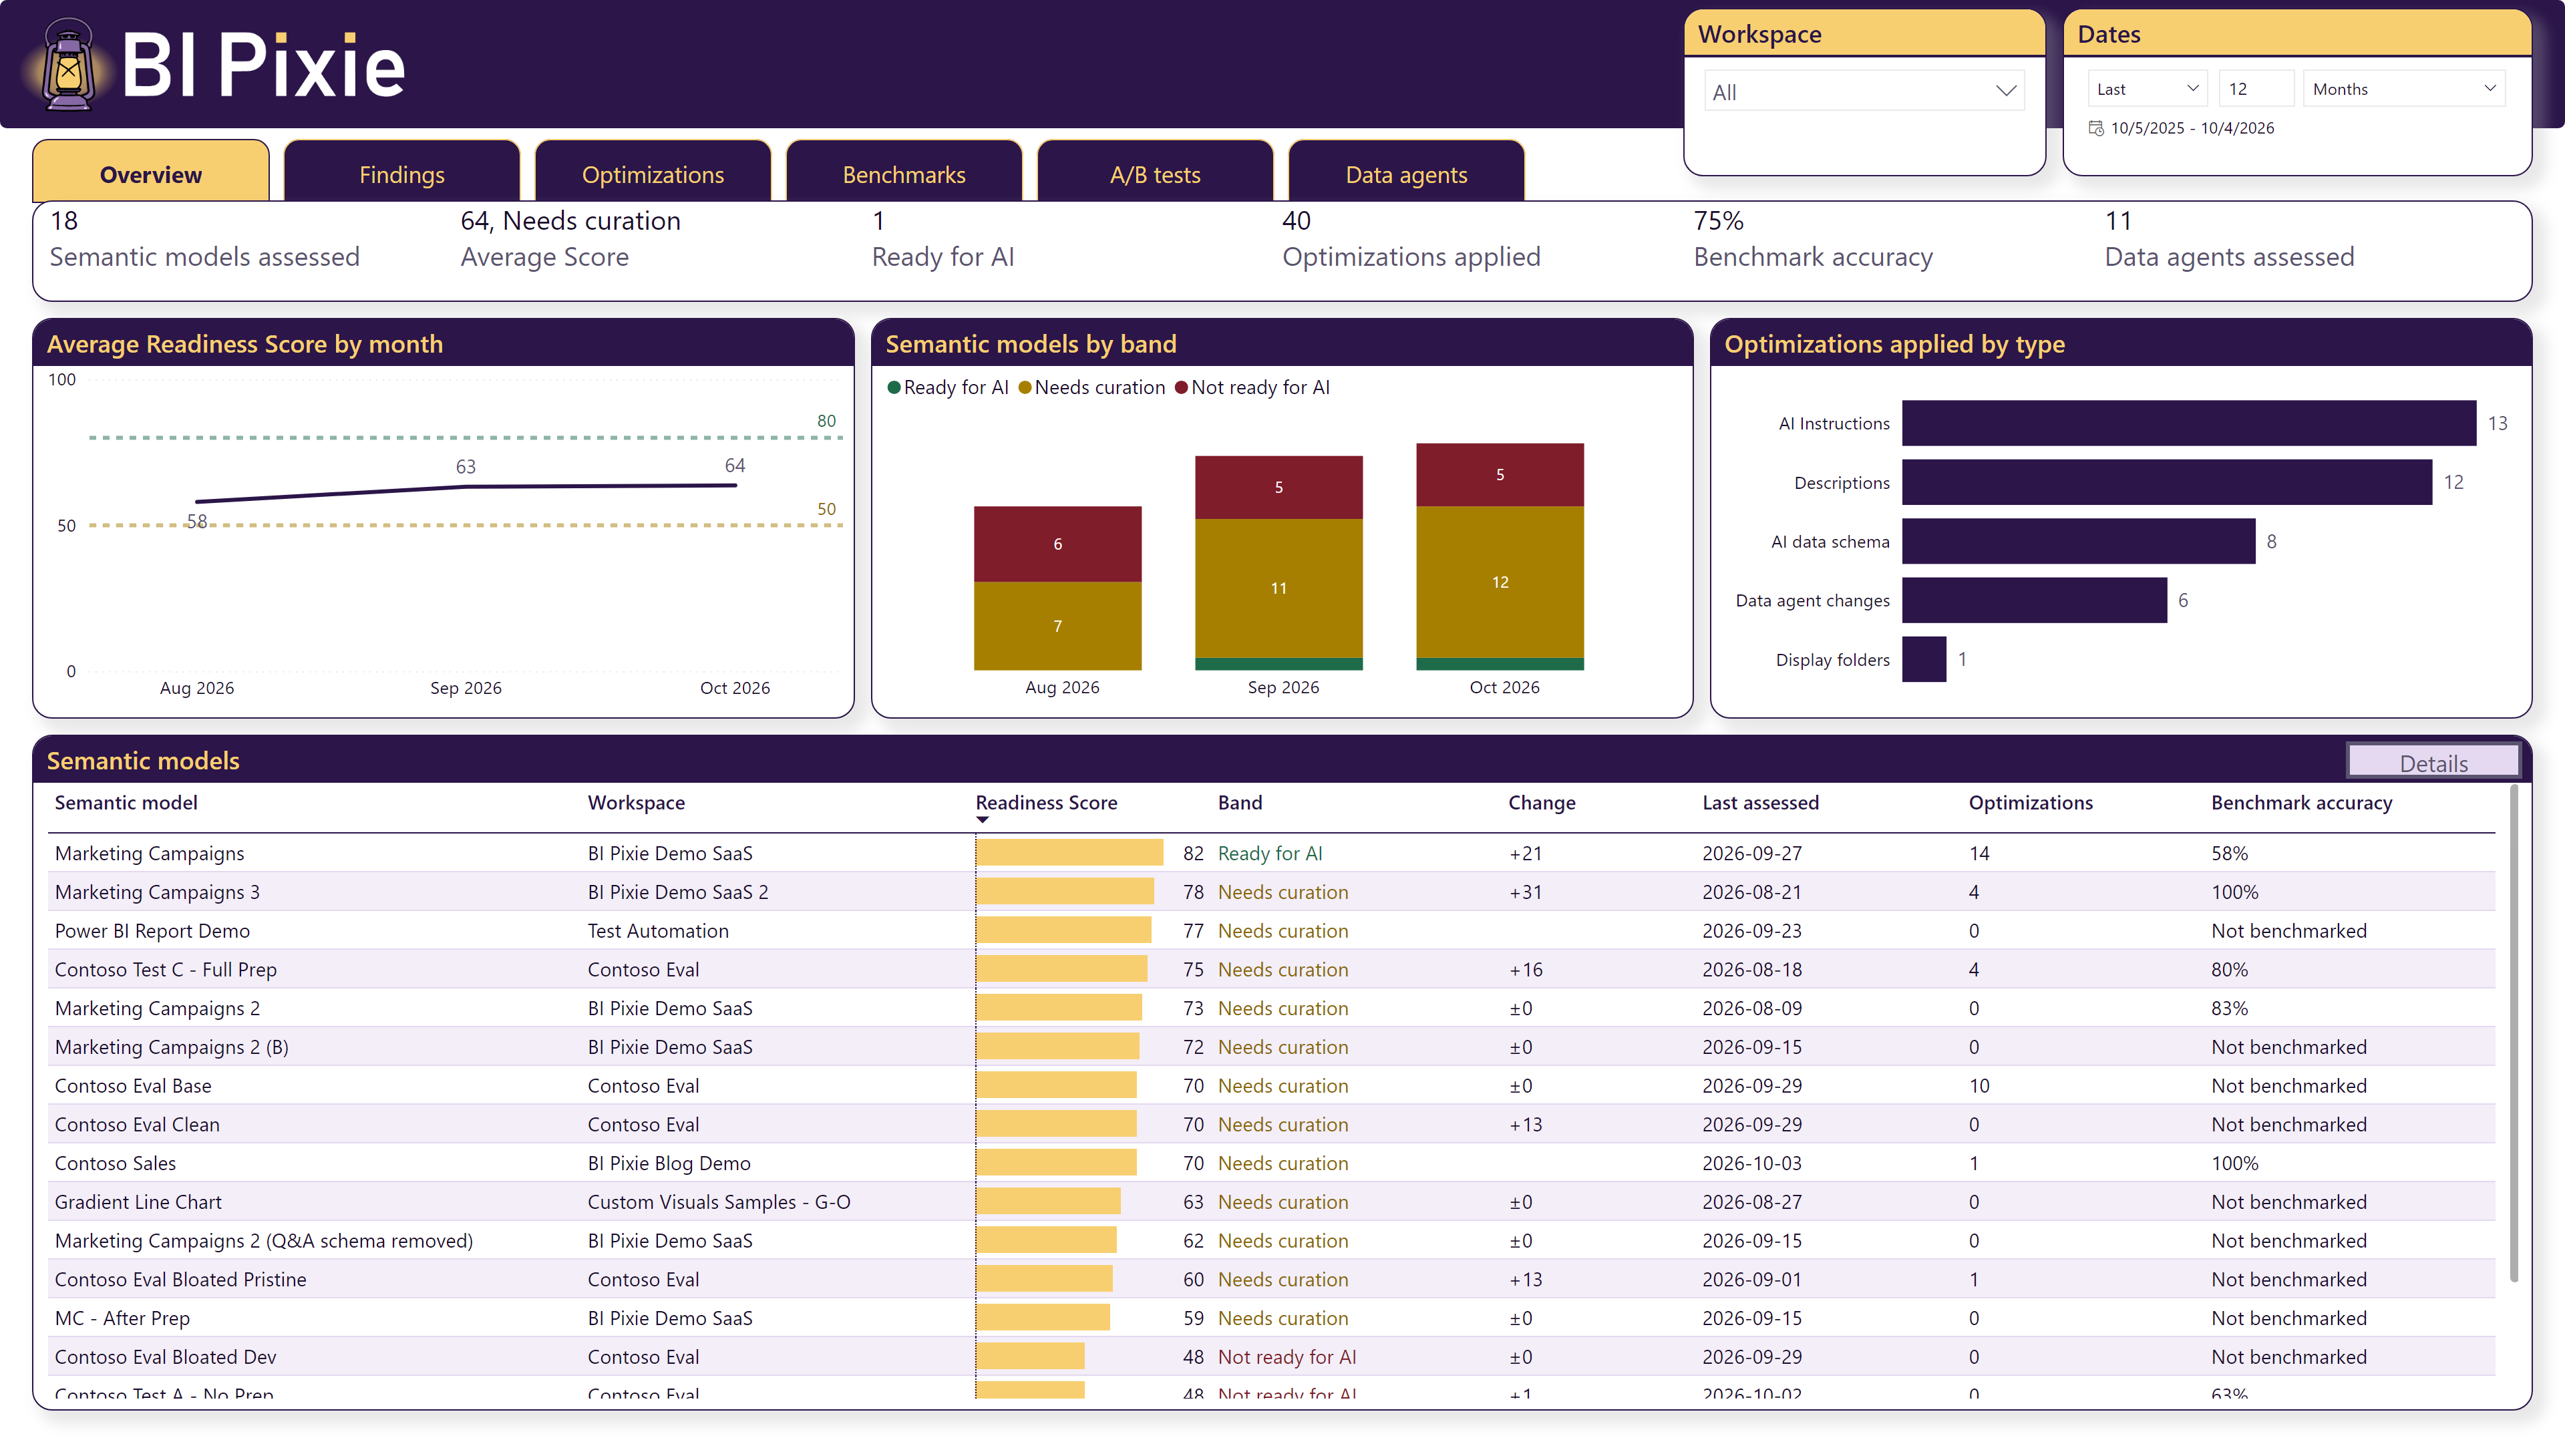
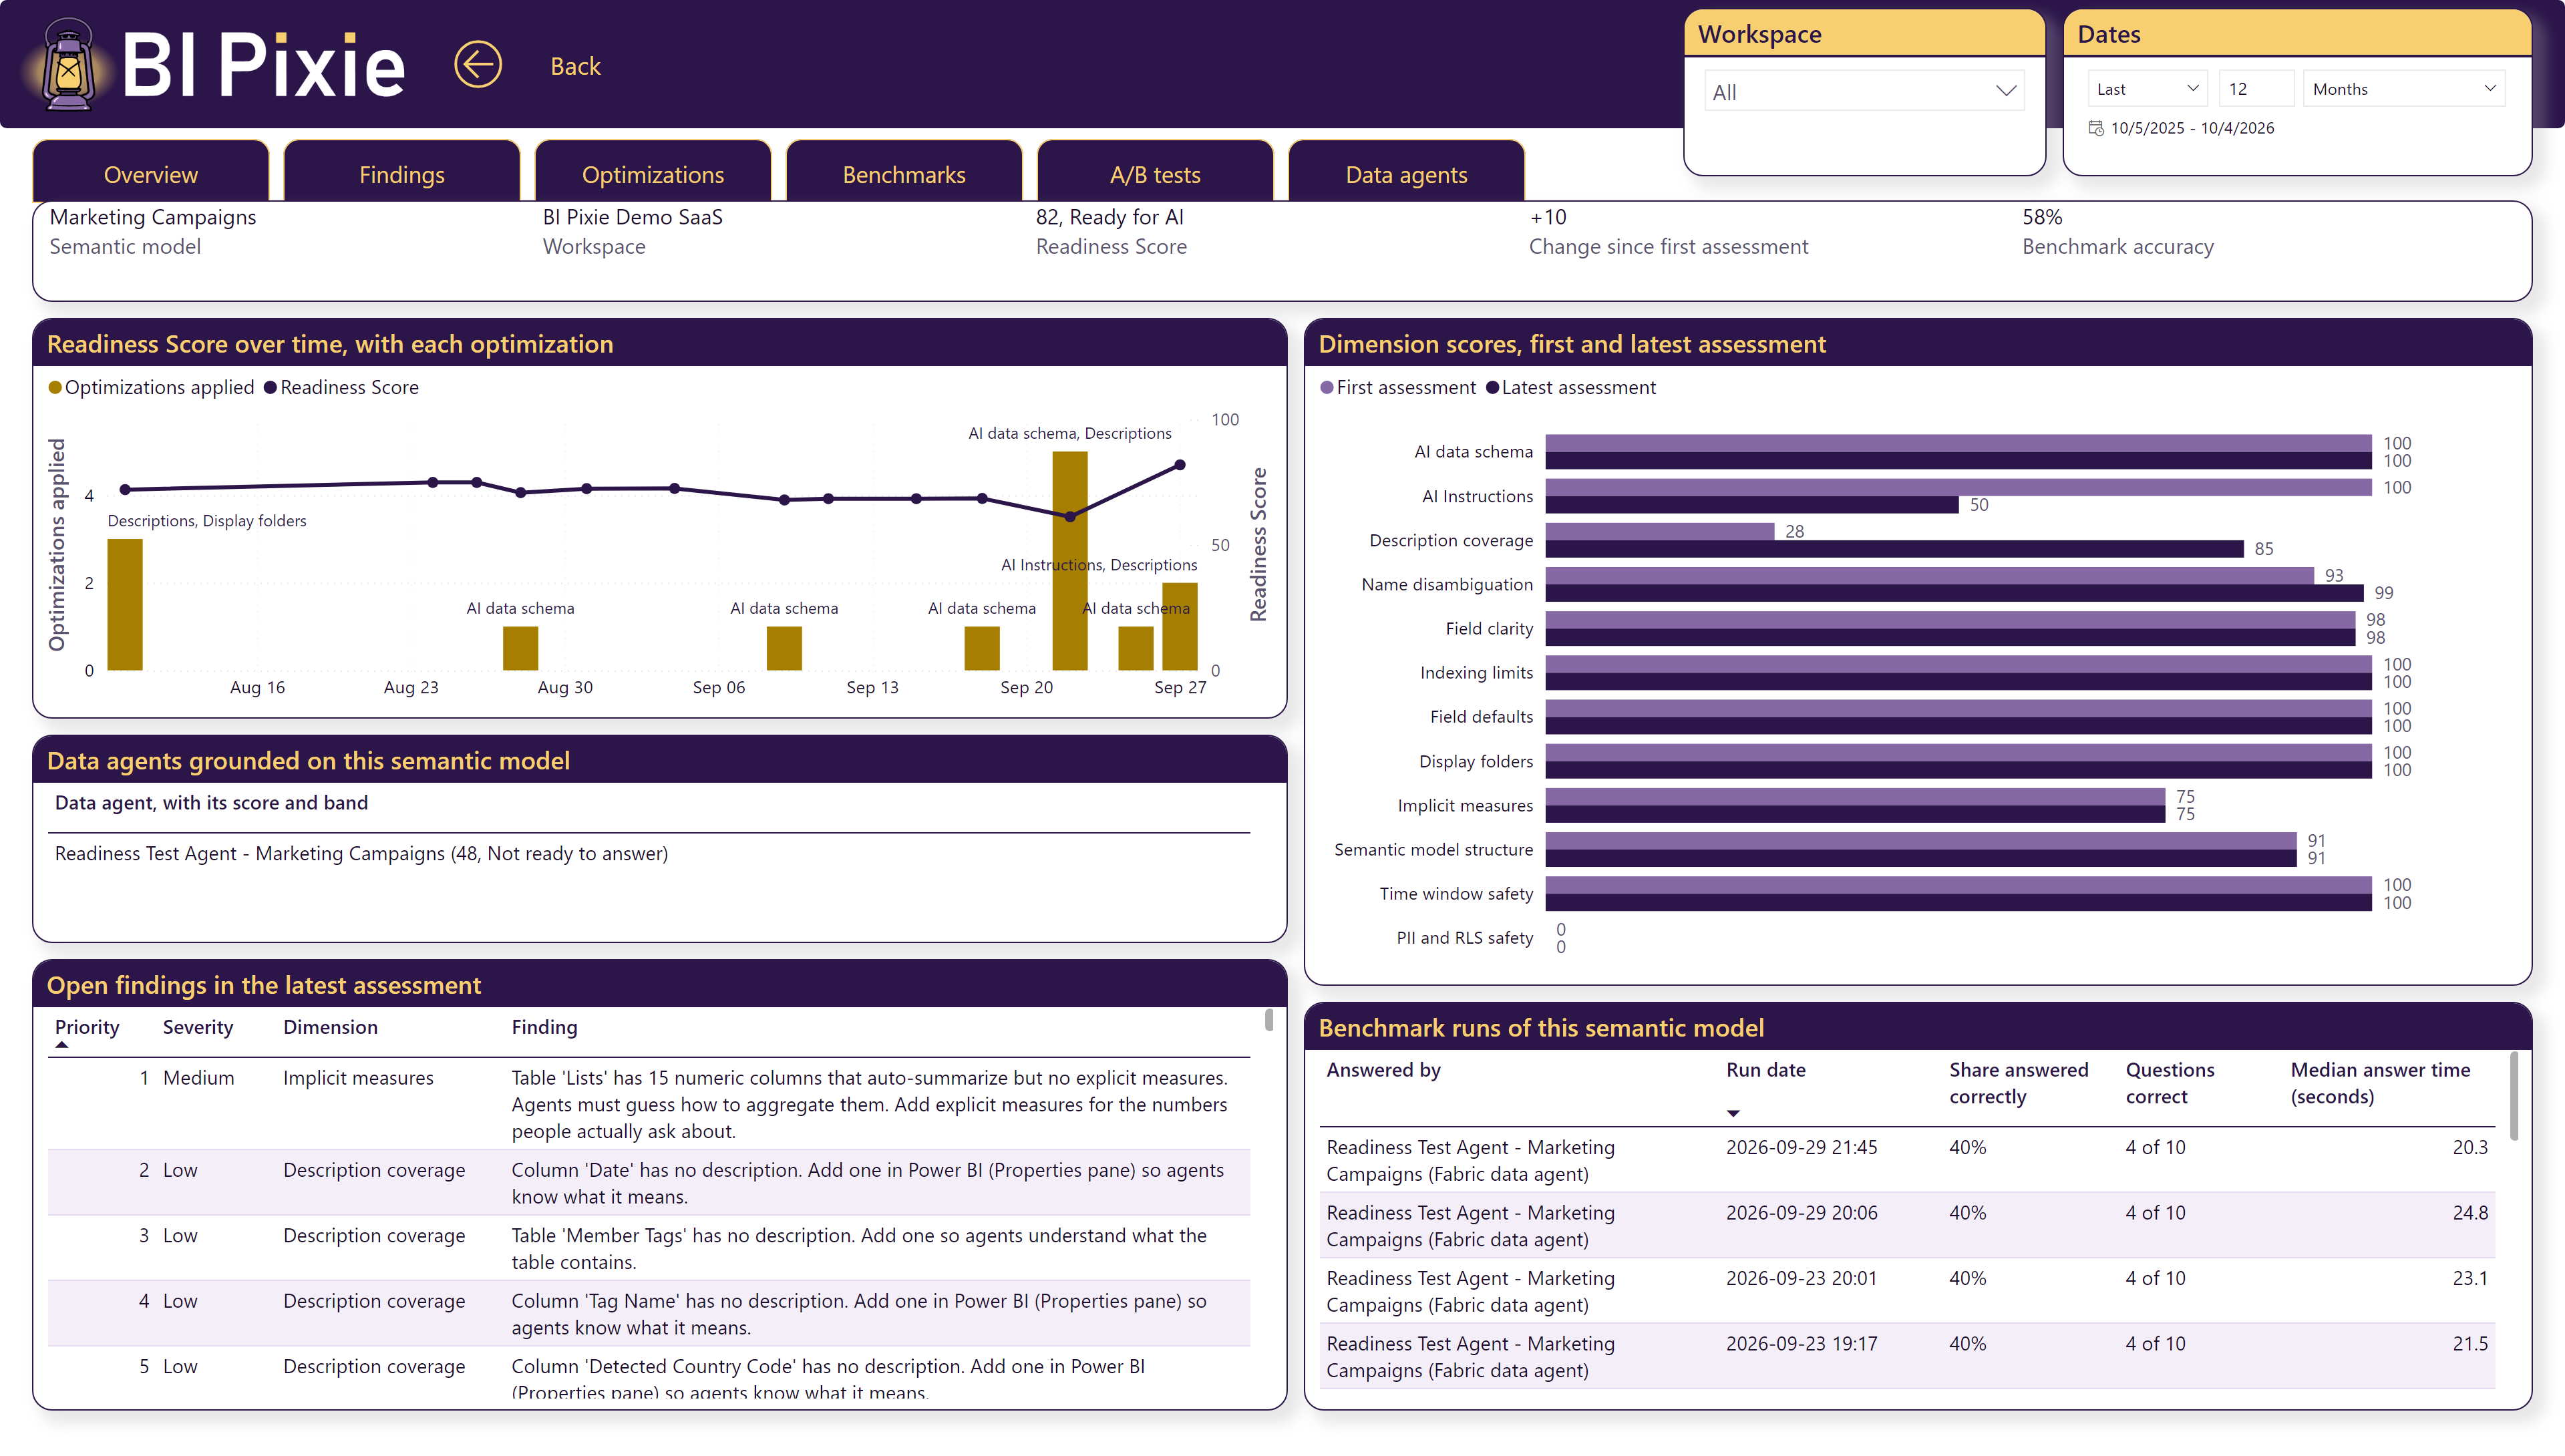
To see one semantic model's history, select its row in the Semantic models table and choose Details. The details page shows that semantic model's score, its change since the first assessment, its benchmark accuracy, and a chart of its score over time with each optimization marked on it. The page also compares each dimension's score at the first and latest assessment, and lists the data agents grounded on the semantic model, its open findings and its benchmark runs. Select Back to return to Overview.
Findings
What the assessments found: Open findings, High severity, Resolved since the first assessment, and Findings on fields used in reports. The charts break the open findings down by dimension and severity, and list the findings that affect the most semantic models.
Optimizations
The optimizations you applied, counted by month, with each optimization beside the score change that the next assessment measured. An optimization whose semantic model has not been assessed since reads Not assessed again yet.
Benchmarks
Your benchmark runs, the latest accuracy with its fraction, for example 71% (213 of 300 correct), the unstable and not scored questions, and the median answer time. A chart shows accuracy by run, with one line for each kind of answerer, and another shows why questions were not scored. The Runs table lists every run.
A/B tests
Each A/B test with its hypothesis, its latest result, for example 58% to 83% (+25 points), and its outcome: Your hypothesis is confirmed., Your hypothesis is rejected., The result is inconclusive., or Not judged.
Data agents
Each data agent you assessed, with its score, band, change since the previous assessment and sources, and the checks that data agents fail most often.
Keep the dashboard up to date
The AI Readiness dashboard is filled by the same refresh as the BI Pixie Dashboard. New assessments, optimizations, benchmarks and A/B tests appear after the next refresh:
- Select Refresh data on the BI Pixie Dashboard card of the item's Overview.
- Or schedule the BI Pixie ETL notebook in your Fabric workspace. See Set up the dashboard.
When an update adds the AI Readiness report to your dashboard, BI Pixie starts one refresh for you if it has the permission to.
Until the first refresh after an assessment, every page shows No AI Readiness data has been loaded yet. Assess a semantic model in BI Pixie, then select Refresh data. The report fills in when the refresh finishes.
Read dates in UTC
Every date in the AI Readiness dashboard is in UTC, and each date label says so, for example Dates (UTC), Last assessed (UTC) and Run date (UTC). The report is shared by everyone who opens it, wherever they are, so it uses one time zone for all of them. The pages in BI Pixie itself show your local time, so a date near midnight can fall on a different day in the two places.
Who sees what
- Anyone with access to the report in your Fabric workspace can open the AI Readiness dashboard. Share it the way you share any Power BI report.
- When your account has more than one license, each license's dashboard shows the work done by the people on that license. Work done by an admin, and work done before your account had more than one license, appears on the main license's dashboard.
- A scheduled assessment appears on the dashboard of the license that owns its schedule.
- The report holds scores, counts and outcomes. It holds no AI answer text, correct values or DAX queries, and it does not name the person who ran each assessment or benchmark.
Ask questions about your AI Readiness history
The BI Pixie data agent and the BI Pixie MCP server read the same tables as the dashboard, so you can ask them questions such as which semantic models improved most this quarter. See AI Assistants.