
Getting Started
This guide walks you through your first steps with BI Pixie inside Microsoft Fabric: create a BI Pixie item, add Pixies to a Power BI report, verify events are flowing, and connect the dashboard to start analyzing engagement.
Before You Start
Make sure you have the following in place:
- A Microsoft Fabric capacity attached to your tenant, either a paid SKU or an active Fabric trial.
- A Fabric workspace where you have Contributor, Member, or Admin role.
- BI Pixie added to your Fabric tenant. A Fabric tenant admin adds it from the BI Pixie page in the Fabric Workload Hub by selecting Add to Tenant, which makes the BI Pixie item type available across the tenant. See the Add BI Pixie to Your Tenant page for the admin steps.
- At least one published Power BI report in the workspace you want to track.
Step 1: Create a BI Pixie item
- Open Microsoft Fabric and navigate to a workspace where you want the BI Pixie Dashboard to live. The reports you track can be in any workspace you have access to. They do not need to be in this one.
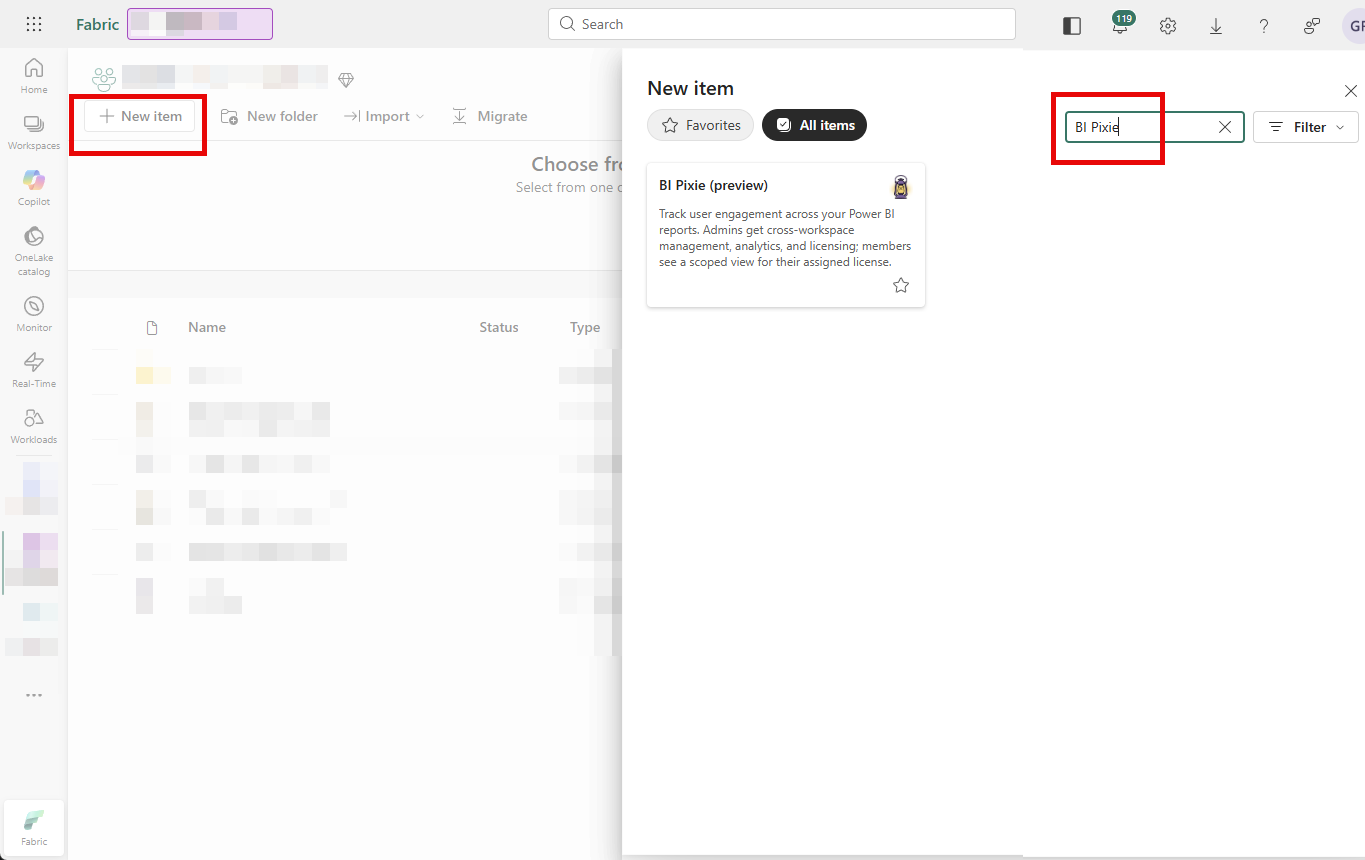
- Select + New item in the workspace toolbar, then select BI Pixie. If BI Pixie is not listed, search for it in the dialog, or ask your Fabric administrator to add BI Pixie to your tenant.
- Give the item a name (for example, My BI Pixie) and select Create.
- The BI Pixie item opens on the Overview view with the workspace context already established. There is no separate sign-in step. Fabric provides your identity automatically.
Step 2: Add Pixies to a Report
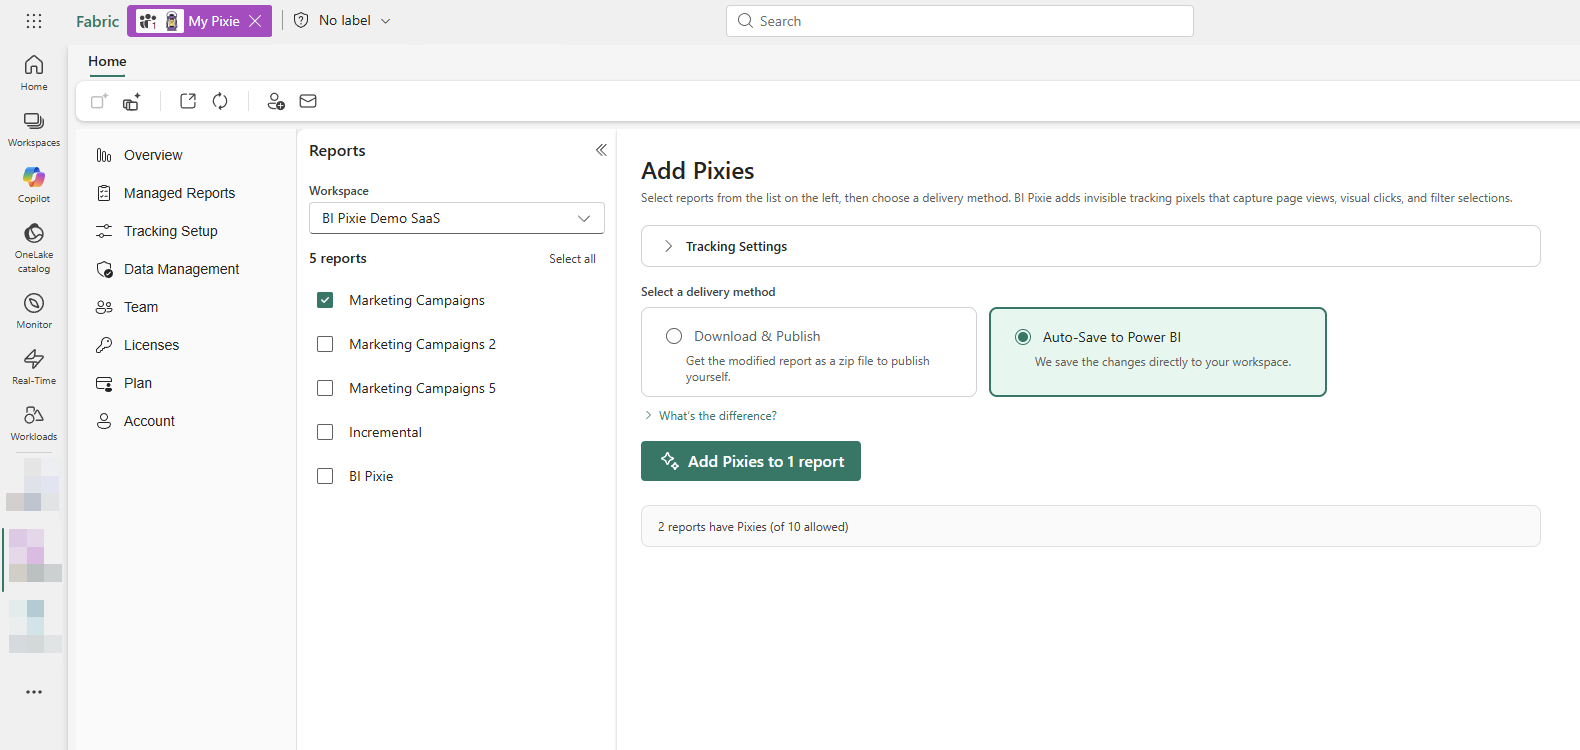
- In the BI Pixie item, open the Managed Reports view from the sidebar and select Add Pixies.
- BI Pixie lists the Power BI reports in the current workspace. To track reports from a different workspace, use the workspace selector at the top of the view to switch to any other workspace where you have Contributor, Member, or Admin role. Select one or more reports you want to track.
- Choose how to apply the changes:
- Auto-Save to Power BI: BI Pixie saves the changes directly to your workspace.
- Download & Publish: you get the report with Pixies as a ZIP file to publish yourself.
- Select the action button, such as Add Pixies. Adding Pixies runs as a background job, so you can keep working in the BI Pixie item while it completes. Progress appears right inside the item.
- When the job finishes, the report appears in the Managed Reports view as a tracked report.
Step 3: Verify Events Are Flowing
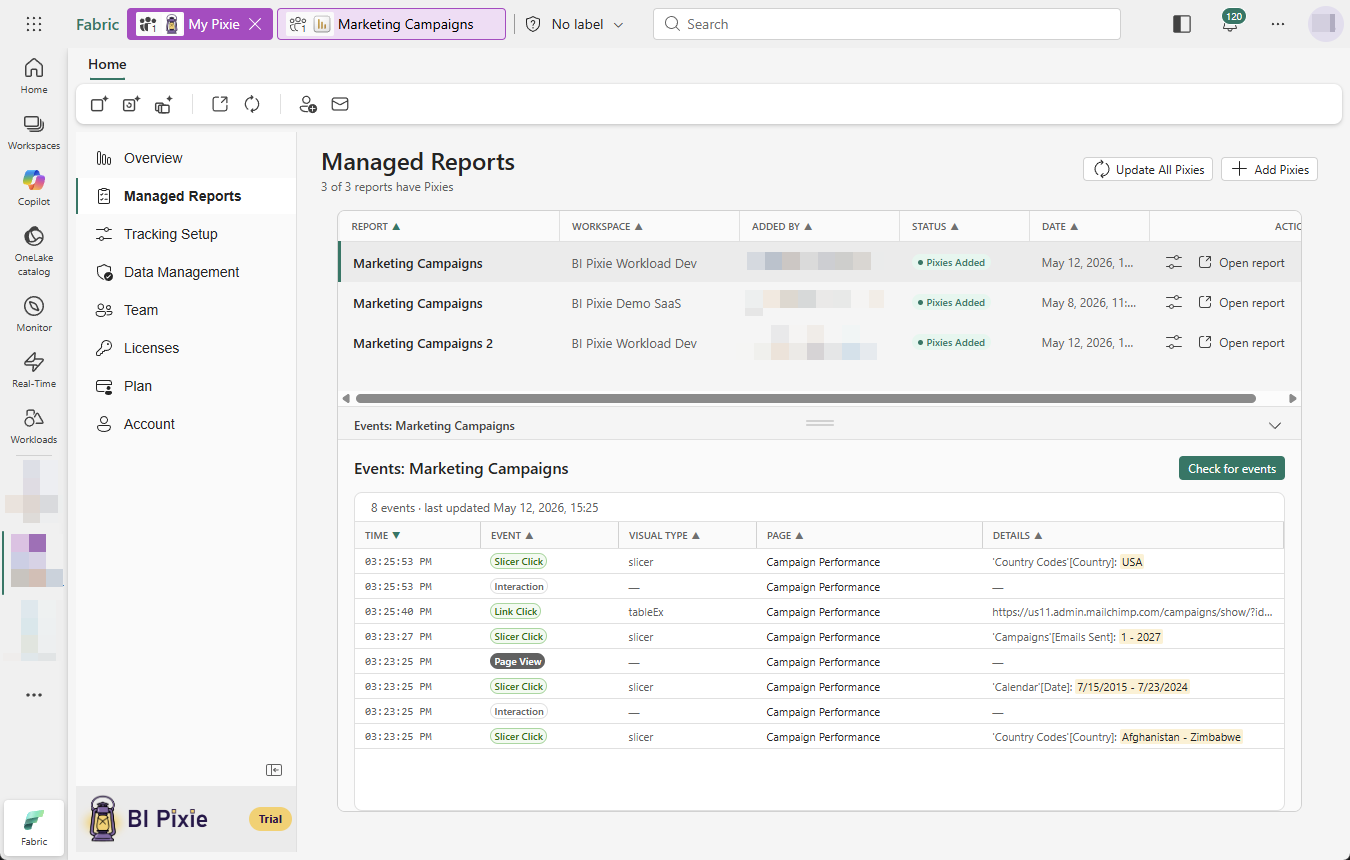
- Open Managed Reports and select Open report on the report's row. The report opens in a new Fabric tab.
- Interact with the report: change a slicer, select a visual, switch pages.
- Return to the BI Pixie item, and in Managed Reports, select the report. Then select Check for events in the Events pane.
- Your interactions appear as events, such as page views, visual clicks, and filter changes. The newest interactions can take a short while to arrive, so if the list is empty, select Check for events again after a moment. Each row shows the event type, the visual type, the page, and the timestamp.
Step 4: Connect the BI Pixie Dashboard
The BI Pixie Dashboard is set up automatically in the same workspace when you create the BI Pixie item. There are no credentials to set up, because the Dashboard is built on a Direct Lake semantic model over your engagement data. The first time you open the item, Microsoft may ask you to approve a one-time consent prompt. To load your engagement data, see Set up BI Pixie Dashboard.
Score Your First Semantic Model
With report tracking, you see how people use your reports once they have used them for a few days. With AI Readiness, you learn something different right away: how well prepared your semantic models are for Copilot and for Fabric data agents. An assessment needs no report activity, so it is the fastest useful thing you can do in a new BI Pixie item.
- Open AI Readiness from the item's sidebar.
- Select Start assessment and pick a semantic model. You can select several and assess them in one run.
- Read the AI Readiness score, 0 to 100, with its band. One score covers Copilot and Fabric data agents alike, and your descriptions, AI Instructions, and AI data schema all count toward it.
- Open Why this score? for the points BI Pixie deducted for each dimension, then open Optimize semantic model below the score card to review the fixes BI Pixie can write for you.
Scoring is read-only: nothing is written to your semantic model, and it runs on BI Pixie's side rather than on your Fabric capacity. Once the semantic model's reports are tracked and have collected some usage, you can reassess the semantic model. BI Pixie then grounds the score in what people actually click, and both the score and the order of the findings become sharper.
What's Next
- AI Readiness: Score, fix, and benchmark your semantic models for Copilot and Fabric data agents.
- Tracking Setup: Customize tracked event types, enable feedback controls, and configure account-level defaults.
- Embed Surveys: Embed NPS, business value, and time-saved surveys directly inside your Power BI reports.
- Overview: Tour the full BI Pixie item and feature set.