
AI Readiness Score Dimensions in Microsoft Fabric
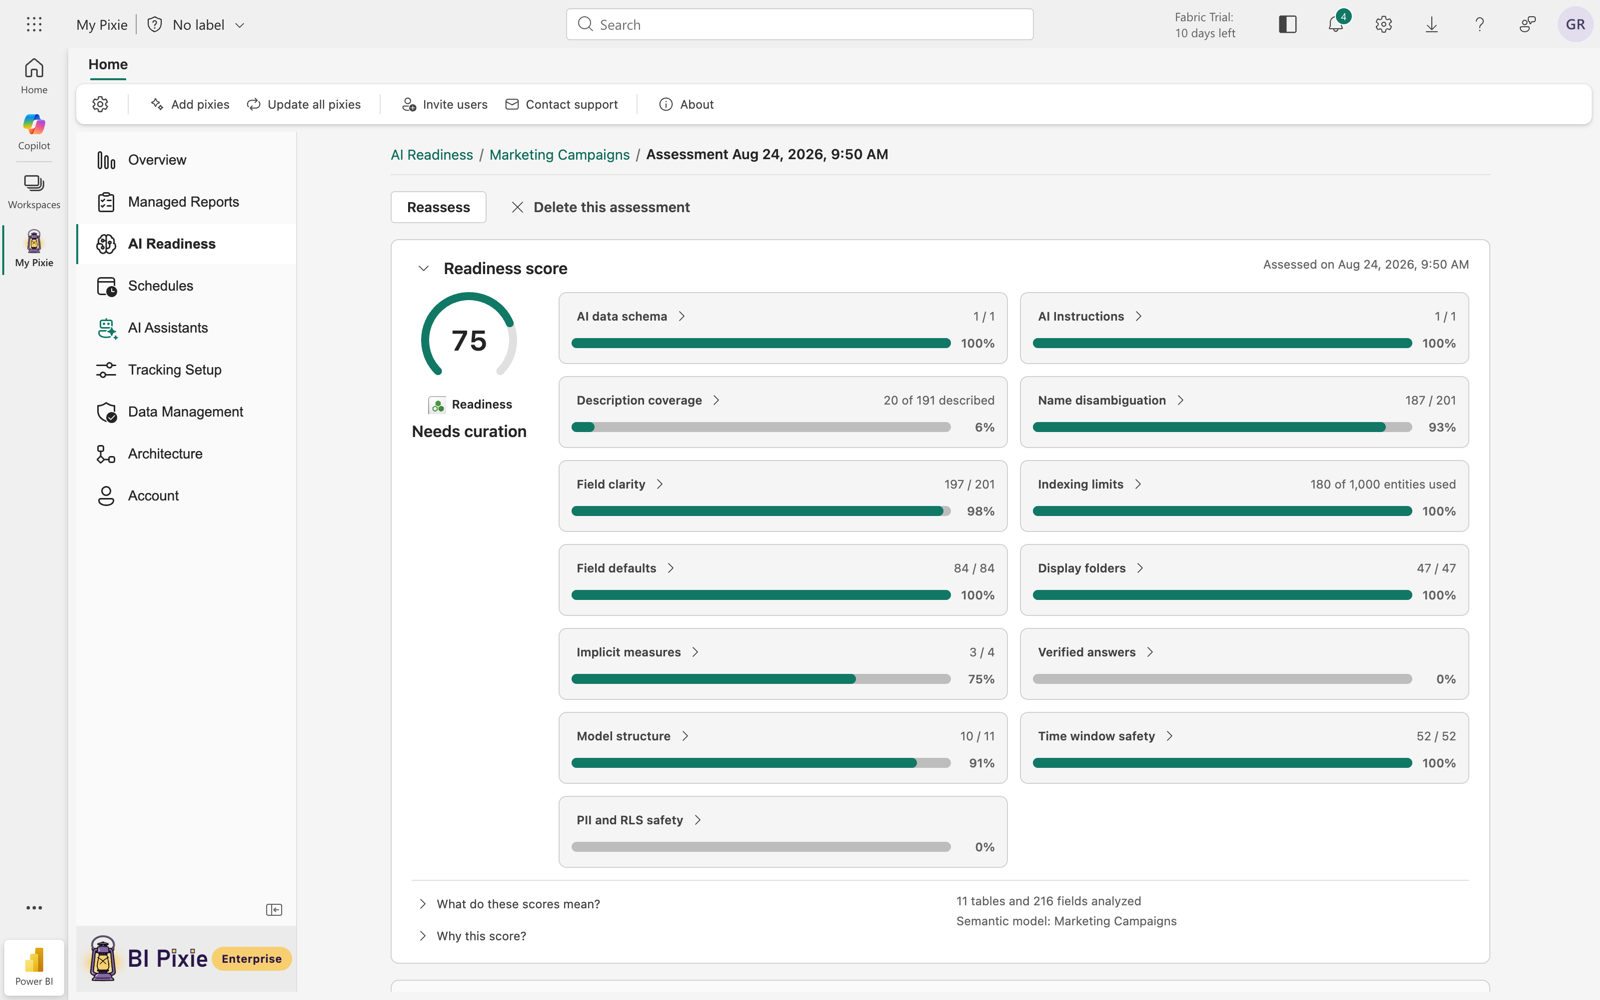
From an AI Readiness score, you learn how much work a semantic model needs before Copilot and Fabric data agents can answer from it. From its twelve scored dimensions, you learn what that work is, and whether BI Pixie can do it for you or you make the change yourself.
Prerequisites
- An assessment result for the semantic model. See Assess a semantic model.
Read a dimension tile
- Open the semantic model's assessment result. Each dimension has a tile with its count, such as 12 of 40 described.
- Select the tile's label to open what the dimension measures. When Microsoft publishes guidance for the dimension, BI Pixie quotes Microsoft's own sentence there, with a Learn more link.
- Review the findings on the Optimize semantic model card, for the fixes BI Pixie can write, and under Fix on your own, for the rest. When usage data is available, each finding carries a badge such as Heavily used, On reports, Never clicked, or Not on any report, so that you can fix what your users rely on first. See Ground the assessment in real usage.
Understand what each dimension measures
In the following table, you see what each dimension checks, why it matters when Copilot or a data agent answers a question, and who makes the fix. When BI Pixie can make the fix, the last column links to the part of the Optimize semantic model card where you make it.
| Dimension | What it measures, and why it matters | Who fixes it |
|---|---|---|
| Description coverage | How many visible tables, columns, and measures carry a description. Where usage data is available, the objects your users engage with most count for the most. Where an AI data schema is set, only the included tables and fields are counted. | BI Pixie, through Write table and field descriptions |
| Name disambiguation | Measures or columns with confusingly similar names. AI agents choose between fields by name, so near-duplicate names lead an AI agent to the wrong field. A field that already carries a description is counted as clear, because BI Pixie never renames fields and a description is how a near-duplicate is told apart. Measures and columns are compared separately, since a measure often shares its name with the column it wraps. | BI Pixie, through Write table and field descriptions |
| Field clarity | Names that are very short, all upper case, underscored, or an abbreviation with a number attached such as Amt2, which both AI agents and people struggle to interpret. Adding a description clears the finding. | BI Pixie, through Write table and field descriptions |
| AI data schema | Whether the semantic model defines a focused subset of its schema for AI. With a curated subset, Copilot and data agents meet less ambiguity and give clearer, more accurate responses. | BI Pixie, through Curate the AI data schema |
| AI Instructions | Whether the semantic model carries AI Instructions from Prep data for AI. In AI Instructions, you give AI agents business context that the schema alone cannot convey: terminology, metric preferences, and how to route questions. | BI Pixie, through Write AI instructions |
| Indexing limits | Whether the semantic model exceeds the number of fields Copilot indexes. Past that limit, Copilot silently sees only part of the semantic model. Trimming the AI data schema keeps the relevant part visible. | BI Pixie, through Curate the AI data schema |
| Semantic model structure | Whether every table is related to the rest of the semantic model. AI agents answer cross-table questions by following relationships, so an unrelated table is invisible to the queries they write. To fix it, relate each orphan table, or remove it when it's obsolete. | You |
| Time window safety | Measures that hard-code a fixed date range. An AI agent may present those results as though they covered all time. | You |
| PII and RLS safety | Columns that appear to contain personal data (PII) in semantic models that have no row-level security, including hidden columns and hidden tables. Hiding is not a security boundary; row-level or object-level security is what removes access. | You |
| Field defaults | Whether text columns summarize by default. When a text column summarizes by default, Power BI shows meaningless totals for it, which confuse AI agents. | BI Pixie, through Fix field defaults |
| Display folders | Whether measures are organized into display folders, so that AI agents and report authors can navigate the semantic model. | BI Pixie, through Organize measures into folders |
| Implicit measures | Whether tables whose numeric columns auto-summarize also carry explicit measures. Without one, an AI agent must decide for itself whether to sum, average, or count the column, so the same question can return different numbers each time it's asked. Writing measures is modeling work, so you make these changes in your semantic model yourself. | You |
Understand a count that differs from the points
On most tiles, the count matches the dimension's points. On three tiles it doesn't, and you see why when you open the tile:
- Description coverage counts every described field once, while BI Pixie weighs the heavily used fields more when it calculates the points. When you describe half the fields and they're the heavily used half, the dimension's score is well above half.
- Indexing limits shows a budget rather than a tally: how many fields the semantic model exposes against how many Copilot indexes. When the first number is higher than the second, Copilot sees only part of the semantic model.
- PII and RLS safety shows no count, because it's a yes or no check.
Considerations and limitations
- Verified answers, the Prep data for AI feature that pairs common questions with approved visuals, has no tile and isn't part of the score. You author verified answers by hand in Power BI Desktop or the Power BI service, and Microsoft offers no API that reads them, so BI Pixie can't see whether your semantic model has any. Leaving the dimension out keeps a semantic model from losing points for something BI Pixie can't check. To review yours, open the semantic model in Power BI and look under Prep data for AI.
- BI Pixie never renames a field. To tell near-duplicate names apart, BI Pixie writes descriptions instead.
- A semantic model can score well here and still need Power BI's own Approved for Copilot mark before the standalone Copilot experience in Power BI returns it in a search. You set and check that mark in the semantic model's settings in the Power BI service. See Mark the semantic model as approved for Copilot.