
Product Overview
AI Readiness and Usage Analytics
for Power BI and Microsoft Fabric
BI Pixie makes your semantic models and Fabric data agents ready for AI, proves AI accuracy on your own data, and shows you which reports your users rely on and which they never open. Pixies collect the usage data once, and both components read it.
Free assessment for up to 500 semantic models and data agents
One product, two components
Usage Analytics and AI Readiness
Usage Analytics
BI Pixie shows you how your Power BI reports are really used: every click, filter, and drill-through, with satisfaction collected inside the report itself. You see which reports pay off and which do not, and you show leadership adoption in numbers rather than anecdotes.
How usage tracking worksAI Readiness
A wrong AI answer looks exactly like a right one, so nobody reports it. BI Pixie makes your semantic models and Fabric data agents ready for Copilot and AI, with your approval of every change, and proves AI accuracy with benchmarks and A/B tests on your own data. BI Pixie ranks that work by the same usage data, so the effort goes to the questions your organization actually asks.
How AI Readiness worksBoth are grounded in the same usage data, collected once by the same Pixies.
Usage Analytics
Three steps to knowing how your reports are really used
Add Pixies to your reports
BI Pixie adds Pixies, invisible tracking pixels native to Power BI, to the reports you choose. They record what people do inside each report, down to the visual.
Users interact normally
As users open, click, filter, and explore your reports, BI Pixie captures each page view, click, and filter silently in the background, wherever you publish those reports. BI Pixie collects viewer user names only when you turn on Capture user identity, and until then it counts viewers by a masked IP address.
Analyze in the Dashboard
BI Pixie sets up its dashboard for you, and there you analyze adoption, engagement, and satisfaction across the reports you track.
BI Pixie in action
BI Pixie makes your semantic models and data agents ready for AI and measures how your reports are used
90-second overview
AI Readiness for Copilot and data agents
In this video, BI Pixie assesses the AI Readiness of your semantic models and data agents from inside Microsoft Fabric, recommends changes based on how people use your reports, and tests a data agent against correct answers calculated from your own data.
7-minute walkthrough
Usage analytics for Power BI reports
In this video, BI Pixie tracks your Power BI reports with Pixies, invisible tracking pixels native to Power BI, and sets up the BI Pixie Dashboard, where you analyze adoption, engagement, and user satisfaction. BI Pixie collects viewer user names only when you turn on Capture user identity, and until then it counts viewers by a masked IP address.
Published on Microsoft Marketplace

Microsoft ISV Partner · Leading Publisher of Power BI Apps

Key Features
Everything you need to understand your Power BI audience
BI Pixie makes your semantic models and data agents ready for Copilot and AI, and goes past the page views that native Power BI usage metrics stop at. Both are grounded in the same usage data, collected once.
Know when your semantic models and data agents are ready for AI
BI Pixie makes your semantic models and Fabric data agents ready for AI. You know which ones are ready and what to fix first, before you go live with Copilot and data agents.
Optimize your semantic models for AI
BI Pixie optimizes the metadata AI needs, drawing on AI assistants, visual-level usage data and lineage to reduce ambiguity. AI drafts the descriptions and instructions, and you approve each one before it is written.
Benchmark Copilot and data agents for accuracy
BI Pixie generates sets of questions and answers to test Copilot or your Fabric data agents. It calculates the correct answers from your own data, and can test your AI to detect inaccuracies before your users do. You run the same benchmark after every change to your semantic models and data agents.
Measure ROI
BI Pixie measures the return on your BI investment with user adoption, engagement, CSAT and NPS scores.
Zero Deployment
You sign up, connect your Power BI workspace, and start tracking in minutes. There is nothing to deploy, because we handle the infrastructure.
Your Data, Your Control
Your data is stored in dedicated storage, isolated from every other customer, and it is encrypted in transit and at rest. BI Pixie collects viewer user names only when you turn on Capture user identity, and until then it counts viewers by a masked IP address. You can delete any user's data yourself and set your own retention period for GDPR compliance.
Beyond Page Views
BI Pixie tracks engagement and interactions, not page views alone. It does this with Pixies, invisible tracking pixels native to Power BI.
Enterprise Scale
BI Pixie is built for large organizations. You can assign licenses to business units for chargeback to cost centers, give each team its own isolated storage, and scale as your Power BI portfolio grows.
Adoption & Attrition Metrics
BI Pixie measures adoption and attrition with dozens of KPIs and time-intelligence metrics, so you see where adoption is growing and where people are quietly abandoning reports.
User Satisfaction
BI Pixie adds feedback controls (thumbs up and down, or smile and frown) and an embedded survey to your reports, so you can measure user satisfaction.
Design Impact
BI Pixie ranks your report designs by complexity, usability and passivity, and shows their impact on user engagement and satisfaction.
Security & Data Governance
BI Pixie detects row-level security misconfigurations and records user activity across reports, so you can spot data access anomalies and support your organization's data governance policies.
Under the Hood
How Pixies track usage inside Power BI
Pixies are invisible tracking pixels native to Power BI. Each one is a pixel-sized table visual with a hidden DAX measure, added to a page of your report and invisible to the people reading it. There is no code injection, no custom visual, and no browser extension.
Connect your workspace
Sign in with your Power BI account and select which reports to track.
Read report definitions
BI Pixie downloads the structural definition of your reports via the Fabric API. Your data is never accessed.
Add Pixies
Tiny table visuals with hidden DAX measures are added to each page. Each measure computes a dynamic URL, and BI Pixie captures the interaction when that URL is requested.
Upload and track
The modified report is uploaded back to your workspace. From that moment, every user interaction is captured silently. You can also download the report and publish it yourself.
AI Readiness
Semantic models and data agents that AI can answer from
BI Pixie makes your semantic models and Fabric data agents ready for Copilot and AI, with your approval of every change, and then proves AI accuracy on your own data. It works with or without Microsoft Fabric, and you can bring your own AI.
Assess
BI Pixie assesses your mission-critical semantic models and data agents in a single run, so you know which ones are ready for AI and what to fix first. It reads their definitions and writes nothing.
Improve
BI Pixie drafts the improvements, ranked by what your users actually query when the reports are tracked. You review every change and choose what gets written.
Prove
BI Pixie asks real business questions of your own Fabric data agent, the same query engine behind Copilot, or a generic AI agent, and grades every answer against the correct one, which BI Pixie calculates by querying your data directly.
Protect
You run the same benchmark after every change to your semantic models and data agents, and BI Pixie compares it with the run before, so a regression is caught before an executive using Copilot reports it.
Architecture
How BI Pixie fits your stack
BI Pixie works with the Power BI you already have, and Microsoft Fabric is optional. Start on Power BI Pro or PPU today. If you run Fabric, BI Pixie adds data, AI, and agent capabilities natively inside your own workspace.
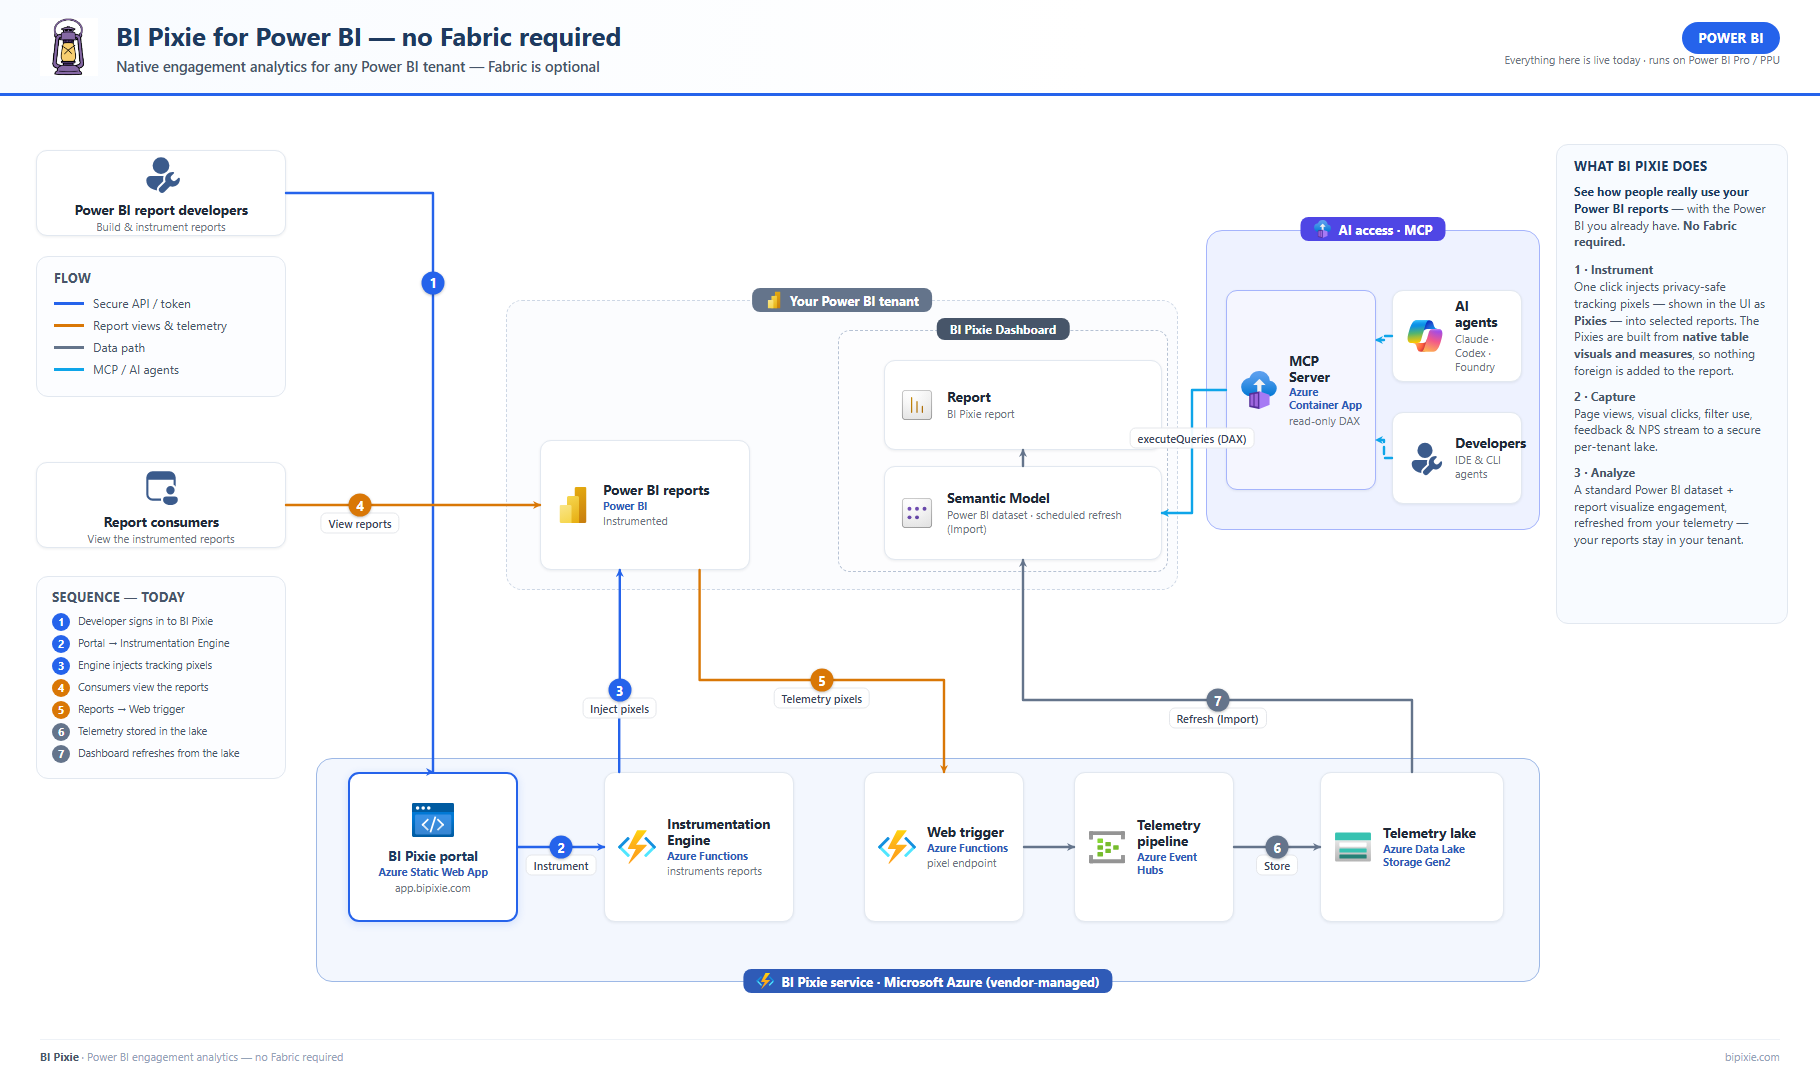
There is no Fabric anywhere in this architecture. BI Pixie's cloud service adds Pixies to your reports and captures engagement telemetry, and the BI Pixie Dashboard is an ordinary Power BI semantic model and report that refreshes from your data, all inside your own tenant.
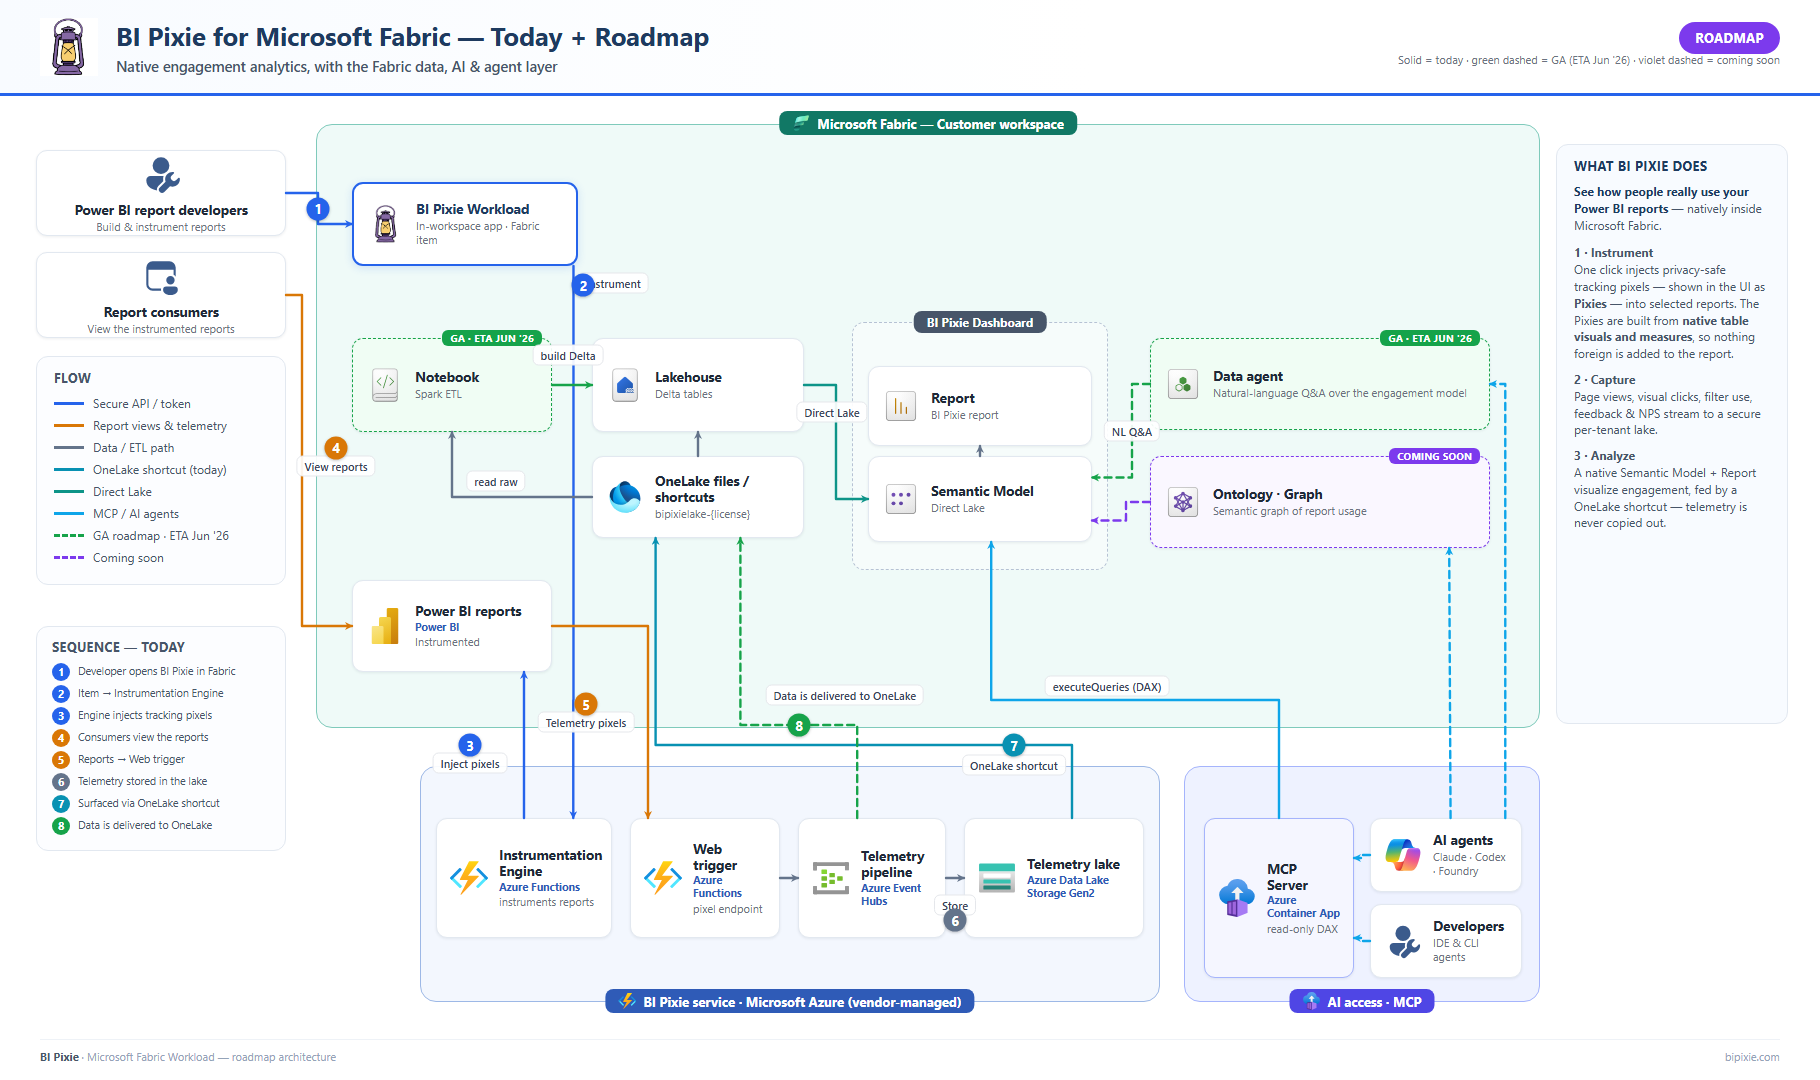
Not sure which fits? Compare all deployments →
Data residency
Where your data lives is your choice
You own your telemetry in every option. Start with zero setup on BI Pixie's storage, or keep your data entirely in your own environment to meet data-residency and sovereignty requirements.
BI Pixie storage
Default · all plans
You get dedicated Azure storage with its own access controls, isolated from every other customer. We place it automatically in the region closest to your Power BI tenant, with nothing to configure.
OneLake delivery
Microsoft Fabric
If you run BI Pixie inside Fabric, you can have events delivered straight to your own Microsoft OneLake lakehouse. Your telemetry stays in your Fabric tenant, and we never retain it in our cloud.
How OneLake delivery works →Bring Your Own Storage (BYOS)
Enterprise
Keep telemetry entirely in your own Azure Data Lake Storage; BI Pixie never stores it. You run BI Pixie on Azure (BI Pixie's self-hosted edition), so events land directly in your account, and you optionally grant scoped, revocable read access for the in-product Data Management tools.
About BYOS →Compare the options in the Data Residency guide. How we process your telemetry in each is set out in our Data Processing Agreement.
Tracking
Tracked Activities
Power BI Usage Metrics only tracks page views. BI Pixie goes further, capturing the full range of user interactions across your reports:
| Activity | Without BI Pixie | With BI Pixie |
|---|---|---|
| Page views | ||
| Clicks on bookmarks | ||
| Clicks on slicers | ||
| Changes in filters | ||
| Clicks on buttons | ||
| Clicks on images | ||
| Clicks on shapes | ||
| Clicks on hyperlinks in tables | ||
| Drill-through actions | ||
| Tooltip views | ||
| Slicing and dicing in visuals | ||
| What data users select in visuals | ||
| User feedback (thumbs up/down, smile/frown) | ||
| Built-in surveys | ||
| RLS data leakage detection |
You choose which activities and fields are collected. Personal fields such as email addresses are off by default, and you can also exclude page names and filtered values.
Security & Privacy
Your data, your control
Every deployment option is secure by default. Your telemetry data is always isolated, encrypted, and under your control.
Isolated Container
Each customer gets dedicated, isolated storage, and your data is never mixed with any other customer's.
Encrypted Always
All data is encrypted at rest and in transit, with TLS 1.2 or higher for every connection and Azure-managed encryption keys.
Your Identity
You authenticate with your Microsoft Entra identity, and BI Pixie's own components authenticate to each other without shared secrets.
Self-Service Deletion
Delete your data at any time from the portal, and set retention periods that fit your GDPR and compliance requirements.
Enterprise Cloud
Dedicated Containers per Business Unit
Assign isolated storage containers to different teams or business units for chargeback and data separation.
Data Sovereignty
Request a dedicated, private environment with isolated compute and storage deployed in the Azure region of your choice.
Dedicated Infrastructure
Your own isolated compute, networking, and storage. Full VNet isolation with private endpoints. No shared resources.
Capabilities
Enterprise-grade features
Each deployment option comes with full capabilities. Choose the one that fits your organization.
All Core Tracking
BI Pixie tracks page views, visual clicks, filter interactions, drill-throughs, tooltips, bookmarks, and slicing and dicing.
User Identity Capture
You see who is using your reports, with hashed or full identity, configurable to your privacy needs.
Visual Interaction Heatmaps
See exactly where users click on each report page with interactive heatmaps.
Slicer & Visual Data Tracking
You see what data your people select in visuals and slicers, for deeper behavioral insight.
Granular Workspace & Report Settings
You configure tracking activities and detail levels per workspace or per report.
Feedback Controls & Surveys
Your users rate the report with thumbs up and down, or smile and frown, and an embedded survey measures satisfaction. Included on the Pro plan and above.
Row-Level Security Auditing
BI Pixie detects RLS misconfigurations and data leakage risks across your report portfolio.
Custom Visual Governance
You see certified, uncertified and unknown custom visuals across your report portfolio.
Configurable Data Retention
You set your own retention period, up to your plan's maximum, and delete any user's data yourself for GDPR compliance.
License & Limit Assignment
You assign tracked item limits per license, with each license's data kept isolated, so costs are attributable to individual business units. Included on the Enterprise plan.
Per-Report Tracking Keys
You rotate tracking keys per report for fine-grained security control. Included on the Enterprise plan.