
Test Events
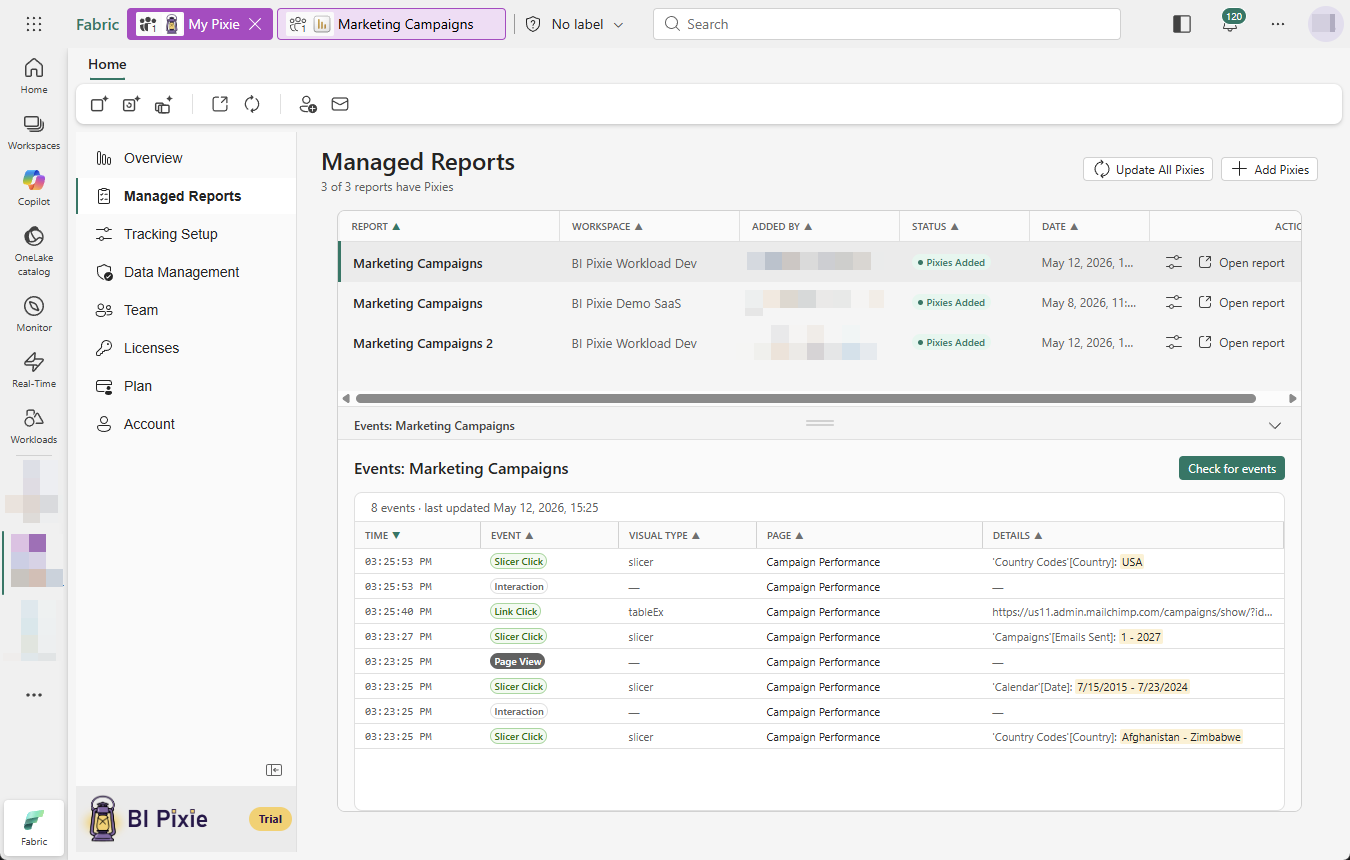
You confirm that Pixies are working in the Events pane, which sits below the report list in the Managed Reports view. The pane is part of that view rather than a separate entry in the sidebar. After you add Pixies to a report, you can open it in Power BI in another browser tab, interact with it for a few seconds, and then return to Managed Reports, select the report, and select Check for events to see the most recent events.
How to Get Here
To get here, open the BI Pixie item from your Fabric workspace, and then open the Managed Reports view from the sidebar. When you select a report in the list, its events load into the Events pane below. You can drag the divider between the list and the pane to give either one more room, or collapse the pane with the chevron on its header bar.
Run a Test
- In the Managed Reports view, select the report you want to test.
- Open the same report in Power BI in a separate browser tab. Use the Open report action on the report's row to open it directly.
- Interact with the report for a few seconds: switch pages, select visuals, change slicers, and hover over tooltips. A wider variety of interactions gives you a more complete test.
- Return to the BI Pixie item. Your report is still selected in Managed Reports.
- Select the Check for events button at the top of the Events pane.
BI Pixie fetches the 20 most recent events for the selected report and shows them in a table.
If events appear, your Pixies are working. If the events table is empty, see Troubleshooting below.
Event Table Columns
| Column | Description |
|---|---|
| Time | When the event occurred. |
| Event | The type of interaction, shown as a color-coded pill (Page View, Visual Click, Interaction, Filter, Slicer Click, Tooltip View, Bookmark Click, Drillthru, Link Click, Feedback, etc.). |
| Visual Type | The type of visual involved in the interaction. |
| Page | The report page where the event occurred. |
| Details | Additional context such as filter values (highlighted in gold), bookmark names, or clicked URLs. |
You can resize a column by dragging its border, and you can sort by any column by selecting its header. If the events include a username, the Events pane header shows it.
What to Expect
- Latency: Each event travels from the report to BI Pixie and through its event pipeline before the Events pane can show it, so the newest interactions can take a short while to appear.
- Page View first: The first event for a session is always a Page View. If you see Page View events but no Visual Click or Filter events, that usually means visual-level tracking or data-selection tracking is turned off in the Tracking Setup view.
- Sampling and limits: The Events pane shows the 20 most recent events for the selected report. The BI Pixie Dashboard holds the full history.
- Viewer identity: BI Pixie collects viewer user names only when you turn on Capture user identity in Tracking Setup, and then the choice on the Account page decides whether it keeps the email address, a masked ID, or nothing. Until then, BI Pixie counts viewers by a masked IP address.
Troubleshooting
No events appearing
If you select Check for events and the table stays empty, try the following in order:
- Confirm the report has Pixies. In the Managed Reports list, verify the report's status is "Pixies Added". If the status is "Pixies Removed" or the report is not listed, go to Add Pixies first.
- Confirm you opened the right copy of the report. Pixies live inside the report definition in your Fabric workspace. If you used Download with Pixies, the downloaded file has Pixies but the workspace copy does not until you publish.
- Wait a moment and select Check for events again. The newest events can take a short while to arrive.
- Hard-refresh the report. Power BI sometimes serves a cached visual layer. Close the report tab in Power BI, reopen it, and interact again.
- Re-run Update Pixies. If the report definition changed after Pixies were added (new pages, moved visuals), the existing Pixies may be stale. Open the action menu on the report's row in Managed Reports and choose Update Pixies.
- Check that interaction tracking is enabled. If only Page View events appear, open the Tracking Setup view and verify that the relevant interaction options (slicer clicks, bookmark navigation, link clicks, etc.) are turned on. Update Pixies after changing settings.
- Check your subscription state. If your plan has expired and you are past the grace period, ingestion is paused. See Licenses for renewal options.
Events appear with a delay
BI Pixie shows an event in the Events pane once the event has passed through BI Pixie's event processing, so a short wait is expected. Event processing runs on BI Pixie's infrastructure, not on your Fabric capacity. If events keep arriving late across several checks, you can contact support.
Wrong username or no username
BI Pixie collects viewer user names only when you turn on Capture user identity in the Tracking Setup view and update Pixies on the report. The choice on the Account page then decides whether BI Pixie keeps the email address, a masked ID, or nothing. Until then, BI Pixie counts viewers by a masked IP address, so events show no username.
What's Next
- Managed Reports: Manage all your tracked reports.
- Tracking Setup: Tune what is tracked at the account, workspace, or report level.
- Set up Dashboard: Load your engagement data into the BI Pixie Dashboard for full historical analytics.