
Review the Proposed Fields in Microsoft Fabric
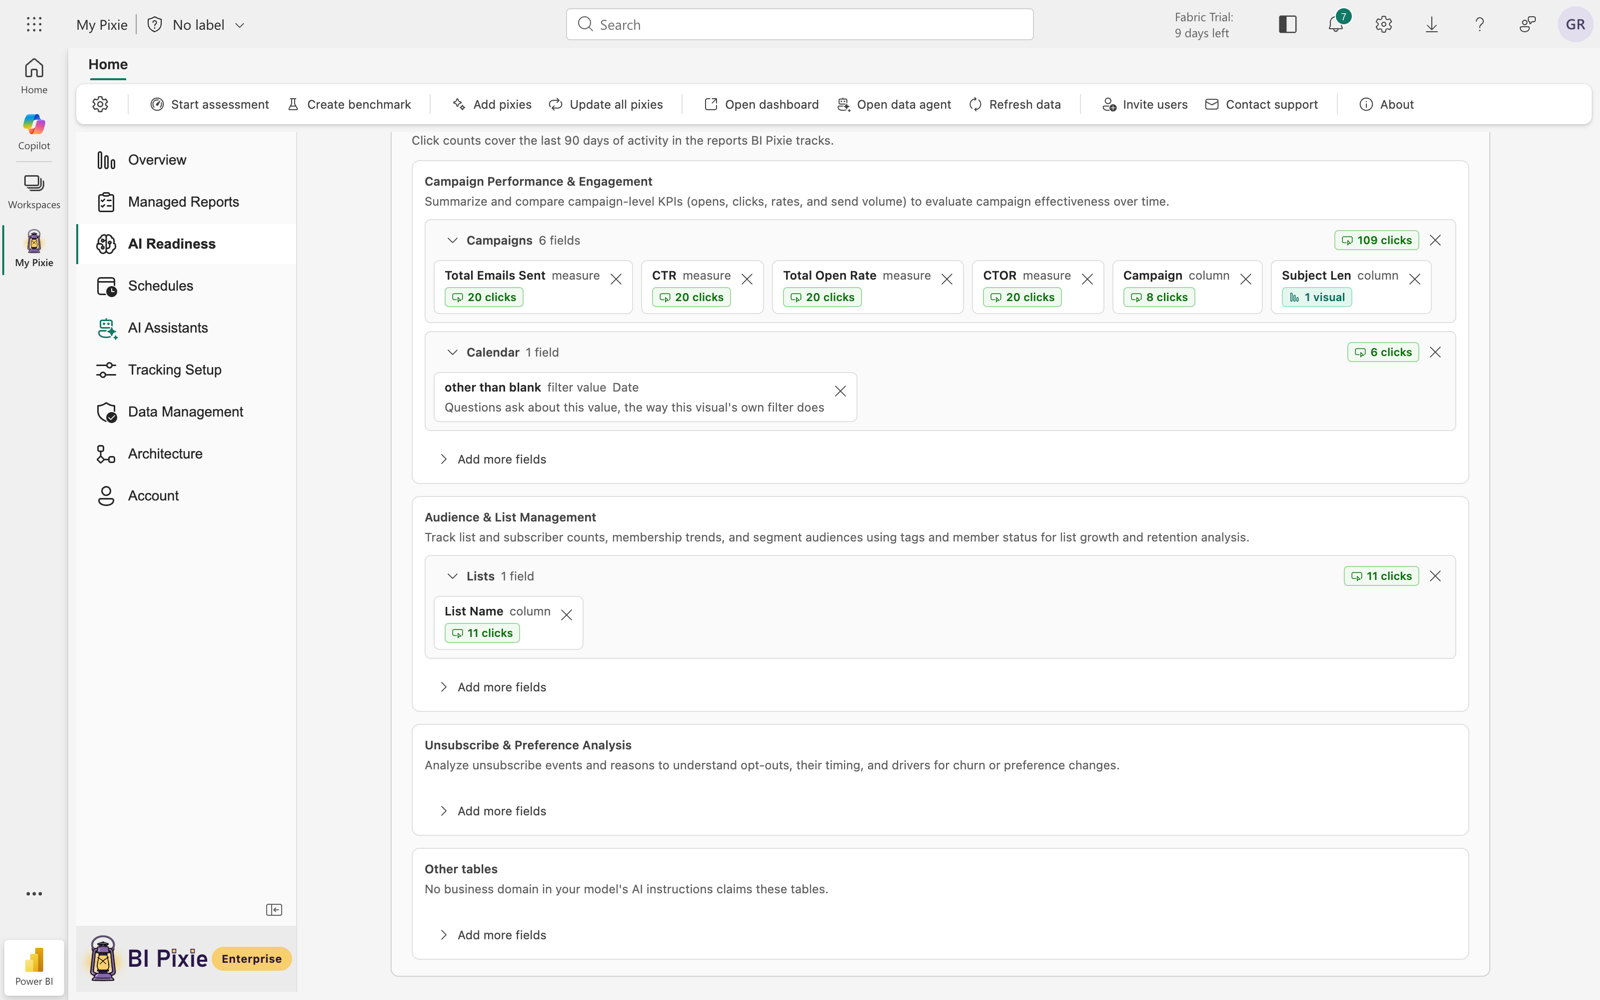
You can review the proposed fields to make sure the questions cover what you care about. Before any question is written, you see the measures, columns, filter values, and report visuals the questions will be built from, and you can remove or add fields.
Prerequisites
- A benchmark open on a semantic model, with the AI to test chosen. See Choose the AI to test.
- Tracked reports on the semantic model, if you want questions built from your report visuals and fields ranked by real usage. See Add Pixies to your reports.
Review and change the fields
- Select Propose fields.
- Under The fields your questions will be built from, review the fields, grouped by business domain and then by table, with the rest under Other tables. Next to each field, you see its evidence, such as how often it's used or which reports show it.
- To leave a field out, select Remove on the field's chip. To add one, select Add more fields in its section, and choose from the ranked list.
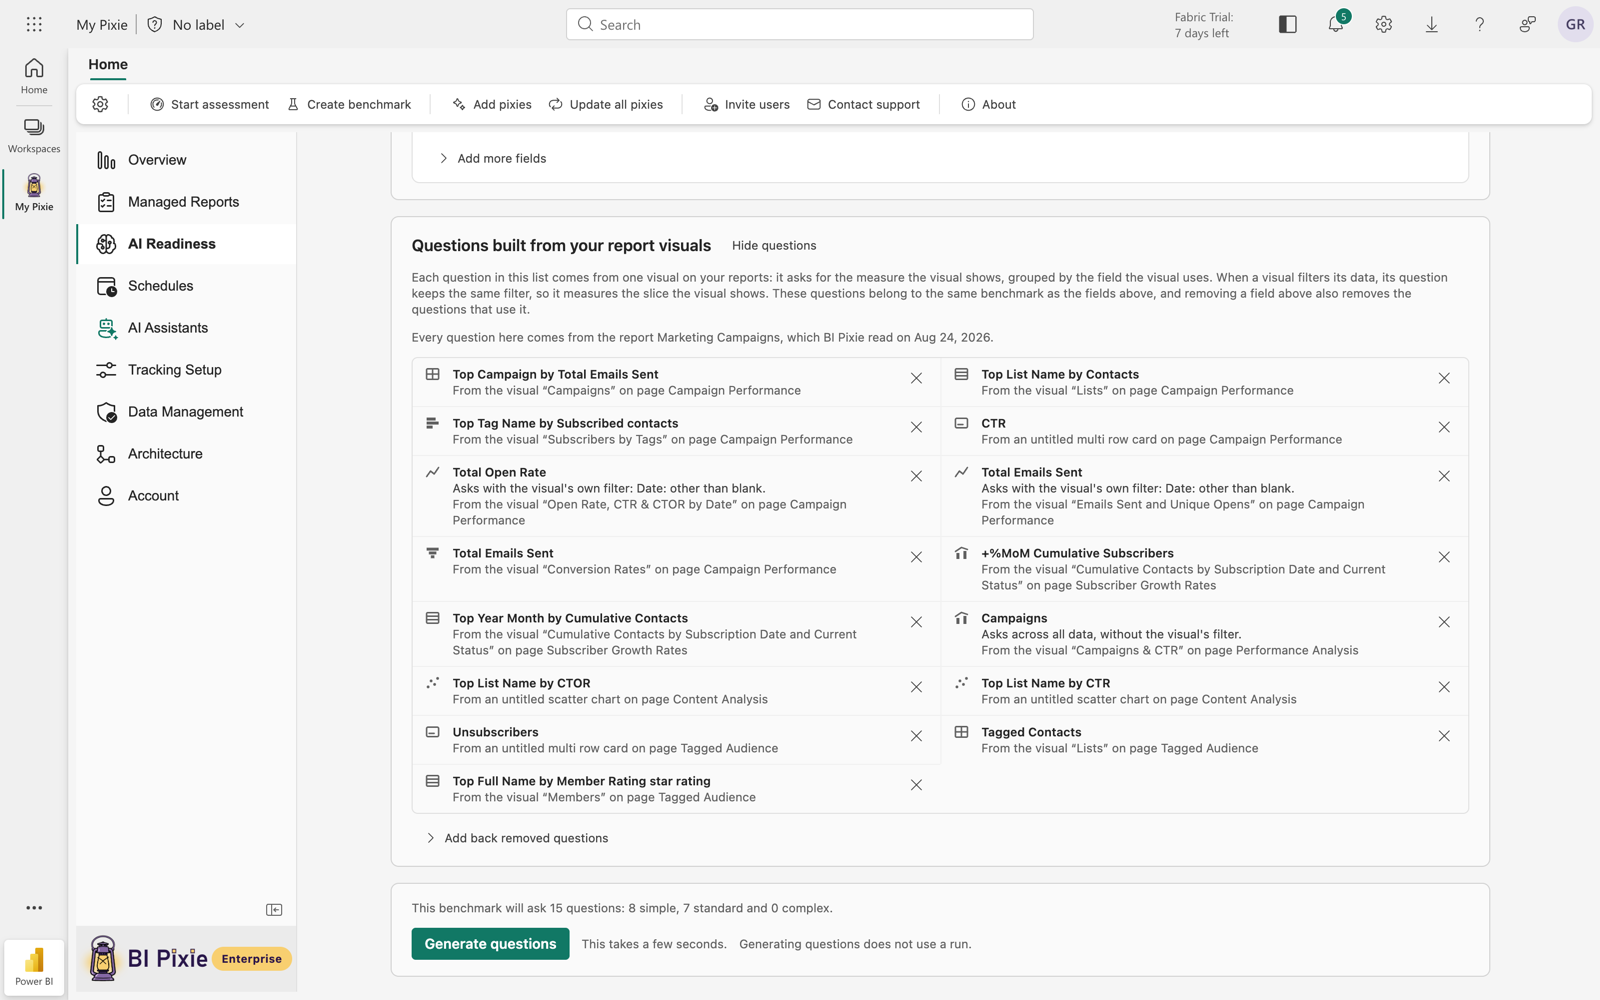
- Under Questions built from your report visuals, review the questions taken from your tracked reports. Each one names the visual and page it came from.
- Select Generate questions. Generating doesn't use a run. On a semantic model with a saved benchmark, confirm that you want to replace the generated questions; the questions you wrote yourself are kept.
After you generate the questions, the proposal folds away. To see it again, select Show the fields, and to fold it, select Hide the fields.
Update the benchmark after your reports change
If your reports change after you build a benchmark, you see Your reports changed since this benchmark was built, with the visuals that are no longer on your reports and the new ones the benchmark doesn't test. To rebuild the benchmark from your reports as they are now, select Propose fields again. Your past runs and their scores are kept.
Considerations and limitations
- When you remove a field, the report questions that use it are removed too. You're told which ones before you confirm.
- A question from a report visual uses the visual's fields, not its exact query. If BI Pixie can't reproduce a chart's filter, BI Pixie asks the question across all data, and the correct answer won't match the chart.
- BI Pixie filters a question from a report visual on text fields only.
- A business domain with no fields isn't listed, unless you selected it in the strategy.
- If you see no questions from report visuals, either no report on the semantic model is tracked yet, or its visuals haven't been read yet. You see which reason applies on the card.