BI Pixie is an innovative solution that tracks and analyzes the usage, interactions, and engagement levels of your Power BI audience. The solution can scan your reports and looks in each report, page and visual for dynamic and static hyperlinks, filters, slicers, bookmarks, tooltips, and drill-through configurations. Then, BI Pixie instruments the reports and semantic models with invisible pixel-size report elements that help you detect user interactions. We named these elements pixies to represent their transformative and magical nature. While the pixies are hidden from view, they work their magic and will help you know your audience and improve your reports.
You can use BI Pixie to instrument your reports. You can run BI Pixie instrumentation on as many reports as you need and re-run it on the same reports whenever they change. BI Pixie fits perfectly in your BI application lifecycle management process or CICD. Once you publish the reports, you can start tracking the usage and engagement events. The pixies will send these events from any Power BI clients that your audience uses to consume reports in Power BI workspaces, apps, embedded, mobile and desktop.
This user guide will walk you through the solution of BI Pixie from setup to engagement analysis.
BI Pixie components
To ensure that the engagement data from your audience will never leave your organization, BI Pixie offers two serverless deployments that can be configured in minutes: Power Platform deployment (also known as Starter version) and Azure deployment.
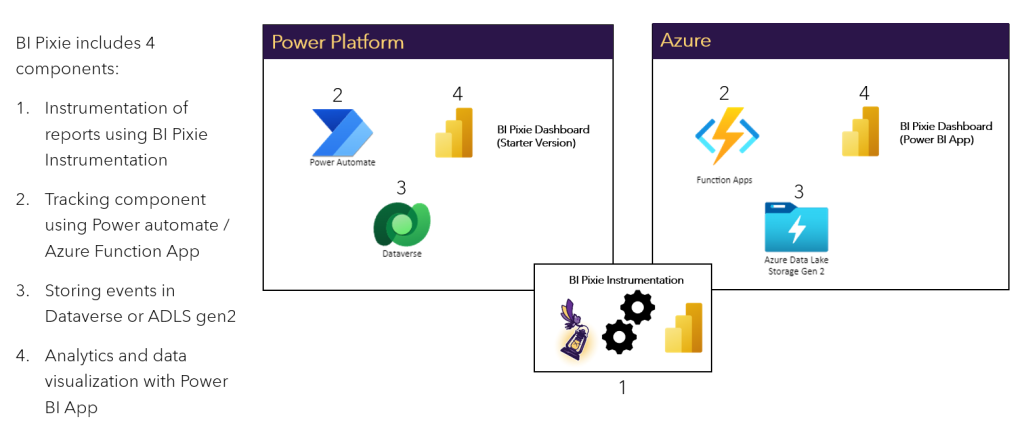
In both the Power Platform and Azure deployments, the BI Pixie Instrumentation tool components is required (Marked as item #1 in the diagram above). It runs on a local machine and instruments the Power BI project files with the pixies that will track usage and engagements from your BI audience once the reports are published.
The Power Platform (Starter) version can be deployed in your Power Platform environment and is suitable for a small number of reports that serve a mid-size BI audience. It includes three components:
- Power Automate web trigger cloud flows that collect the engagement events from your BI audience (Marked as item #2 on the left side of the diagram above).
- Dataverse tables that store the events and inventory (Item #3 on the left side of the diagram above).
- A Power BI app that connects to the dataverse table and analyzes the usage and engagement of your BI audience (Item #4 on the left side of the diagram above).
The Azure version can be deployed in your Azure tenant is can easily scale to fit high usage of large BI audiences. It includes the following components:
- One or two Azure Function Apps to collect the events (Marked as item #2 on the right side of the diagram above).
- A Data Lake Storage Gen2 account that stores your BI audience events (Item #3 on the right side of the diagram above).
- A Power BI app that connects to the Data Lake storage and analyzes the usage and engagement of your BI audience (Item #4 on the right side of the diagram above).
Choose the Azure deployment version to get the full set of features. The following tables provides a summary of key capabilities of BI Pixie by deployment version:
| Features (Source) | Power Platform Deployment | Azure Deployment |
|---|---|---|
| Instrumented Events (Pixies) | V | V |
| Feedback Controls (Pixies) | V | V |
| Embedded Surveys (Pixies) | V | V |
| Data Auditing (Pixies) | V | V |
| Performance (Azure Log Analytics) (Read more here). | – | V |
| Producers and Consumers (Power BI Activity Logs) | – | V |
| Business Outcome by Endorsement and Data Sources (Power BI Admin Scan API) | – | V |
| Export Auditing (Pixies + Azure Log Analytics) | – | V |
| RLS Auditing (Pixies) | – | V |
Setting Up BI Pixie
Before you set up BI Pixie, it is recommended to install BI Pixie Dashboard in your Power BI account. BI Pixie Dashboard is a Power BI App that is available in Microsoft AppSource. You can explore BI Pixie Dashboard with a sample data before you start the deployment. The Power BI app comes in two versions: Starter and Azure.
When you are ready to set up BI Pixie, follow the user guide.
- Deploy BI Pixie to collect usage and engagement events
- Instrument your Power BI reports following the instructions here.
- Test the instrumented reports and publish them following the instructions here.
- Connect BI Pixie Analytics following the instructions here.
- Learn about the visuals available in BI Pixie Analytics here.