Detect Data Leakage Due to Flaws in RLS Implementation
Row-Level Security in Power BI is only as strong as its implementation. BI Pixie's new RLS auditing feature detects when users access data they should not see, helping you identify and fix security gaps before they become breaches.
When it comes to securing sensitive business data in Power BI, Row-Level Security (RLS) is your last line of defense—but even well-intentioned configurations can go wrong. BI Pixie shines a light on hidden vulnerabilities by auditing your RLS setup in real time. Whether it’s users with excessive access, missing roles, or views exposed due to conflicting filters, BI Pixie surfaces issues that are often missed by manual reviews or static governance reports. This isn’t just about compliance—it’s about proactively preventing data leakage, and operational blind spots that can erode the trust of your stakeholders and BI audience.
In the article, you’ll discover how BI Pixie empowers Power BI admins and Semantic Model developers to detect misconfigurations as leaks happen. Uncover how many users are protected—or unprotected—by RLS, identify over-blocking scenarios that limit usability, and track suspicious changes in access logic that may hint at broader issues. With these insights, you can move from reactive troubleshooting to proactive governance, ensuring the right people always see the right data—and only the right data.
RLS Auditing
BI Pixie provides a comprehensive audit of Row-Level Security (RLS) in Power BI, helping identify misconfigurations, overexposed data, and potential security risks as they happen. It highlights users with RLS issues such as missing roles, over-blocking, and suspicious changes.
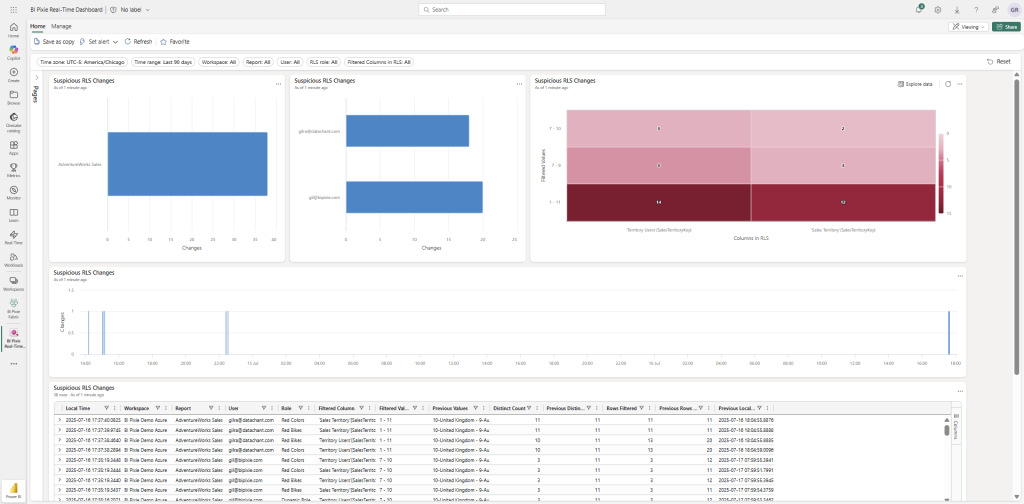
RLS alerts can be analyzed in BI Pixie Dashboard in both its Power BI report component and in Microsoft Fabric Real-Time Intelligence (RTI) dashboards. This dual delivery ensures that you can monitor Row-Level Security issues through interactive reports for historical analysis or track them in real time using RTI dashboards—empowering both analysts and security teams to stay ahead of access risks.
RLS Auditing in BI Pixie Dashboard (Power BI report)
In RLS Auditing page (1st tab), you have a break down of RLS alert metrics by report, user and date. Learn where and when large volumes of data are unintentionally visible due to weak RLS configurations. Supporting insights include overexposed row counts, filtered value distributions, and detailed metrics by table and role—empowering admins to pinpoint and remediate critical access issues quickly.
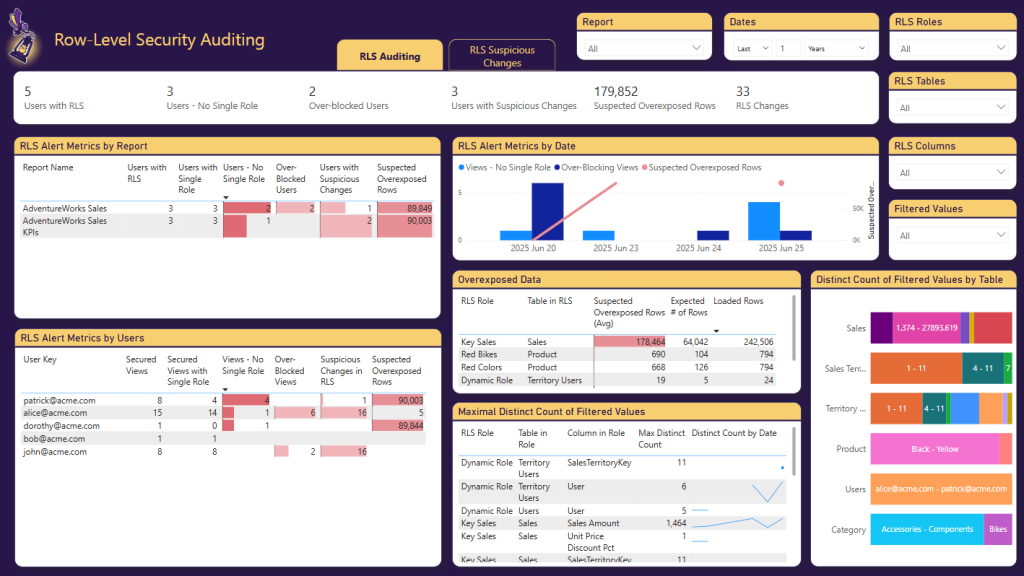
Here are the main RLS Alert Metrics you can analyze:
-
Users and Page Views protected by RLS
- Users with RLS The total number of users assigned at least one RLS role in the report.
- Secured Views The total number of Power BI page views the user accessed that are protected by Row-Level Security.
-
Single RLS role
- Users with Single Role Users who are assigned exactly one RLS role, which is generally considered a best practice to avoid role conflicts.
- Secured Views with Single Role The subset of secured views where the user had exactly one RLS role applied—helpful for identifying clean, unambiguous access.
-
No Single Role
- Users – No Single Role Users assigned multiple roles or no role at all—indicating either ambiguity in access or incomplete RLS configuration.
- Views – No Single Role Count of Power BI page views that accessed by users who either had multiple RLS roles or no role at all—indicating potential access conflicts or gaps.
-
Over-blocking situations
- Over-Blocked Users Users whose RLS configuration results in them seeing little or no data, possibly due to overly restrictive filters or missing association to their data in logic.
- Over-Blocked Views Count of Power BI page views where the applied RLS filters were too restrictive, resulting in empty or severely limited data—potentially impacting usability or revealing misconfigurations.
-
Suspicious Changes in RLS Logic
- Users with Suspicious Changes Users who have experienced recent, unexpected changes in RLS assignments or accessible data values, suggesting a need for closer review.
- Suspicious Changes in RLS Count of Power BI page views where changes in RLS assignments led to unexpected shifts in the data shown to the user—potentially signaling unauthorized access or errors.
-
Suspected Overexposed Rows This metric estimates the number of data rows that may be unintentionally visible to users due to weak or misapplied RLS filters—indicating potential data leakage. This metric is common for users with multiple matching roles.
RLS Suspicious Changes (2nd Tab)
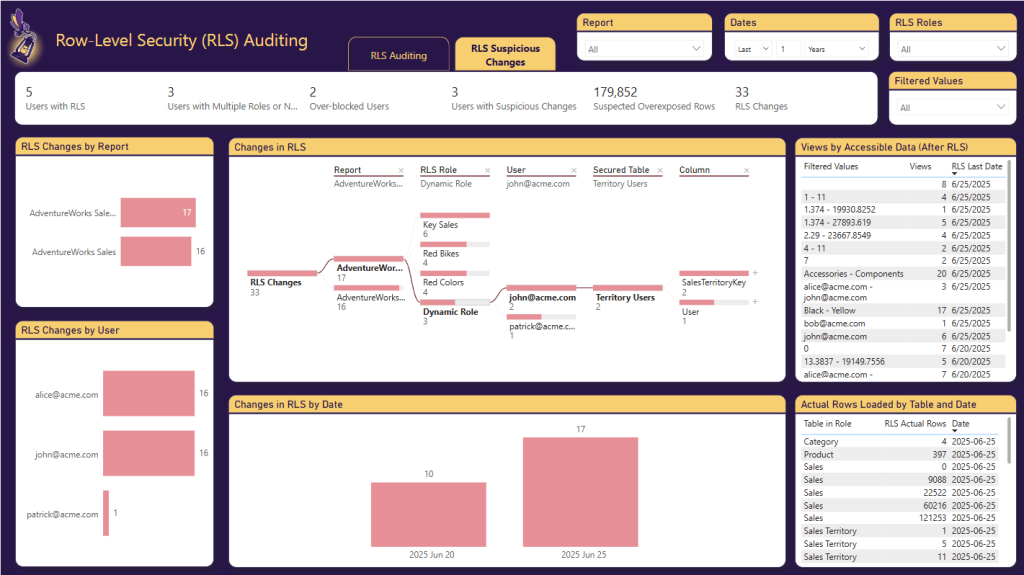
In RLS Suspicious Changes, you can find suspicious changes in Row-Level Security (RLS) implementations by tracking shifts in the data users can access, as monitored in real time by BI Pixie. The interactive decomposition tree allows you to drill down from reports to specific RLS roles, users, secured tables, and columns—helping you pinpoint exactly where filtered values have changed. This view makes it easy to investigate potential misconfigurations or access escalations across your Power BI environment.
RLS Auditing in Fabric Real-Time Dashboard
RLS events are detected in real-time as your end-users open your Power BI reports. But using BI Pixie Dashboard, you can only analyze alerts after the next refresh of BI Pixie’s Semantic Model. If you need real-time monitoring of the RLS alerts, you can use our new integration with Microsoft Fabric RTI. Starting from this month (August 2025), you can deploy BI Pixie on Fabric Real-Time Intelligence (RTI) to monitor RLS in real-time and escalate it as suspicious leaks are detected.
In the flow diagram below, you can find the components of BI Pixie and where they integrate with Fabric Real-Time Intelligence (RTI).
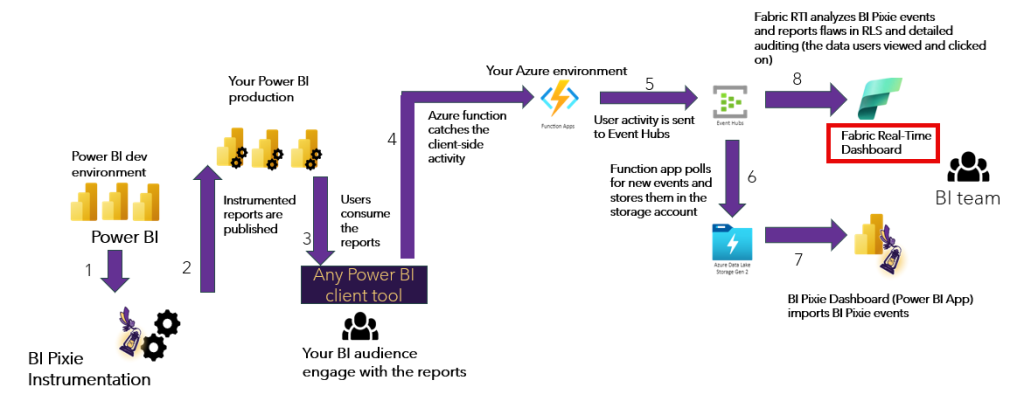
With the new integration, organizations can deploy BI Pixie on their Azure account, and add Fabric RTI Eventstream and RTI Eventhouse to analyze usage events in real-time.
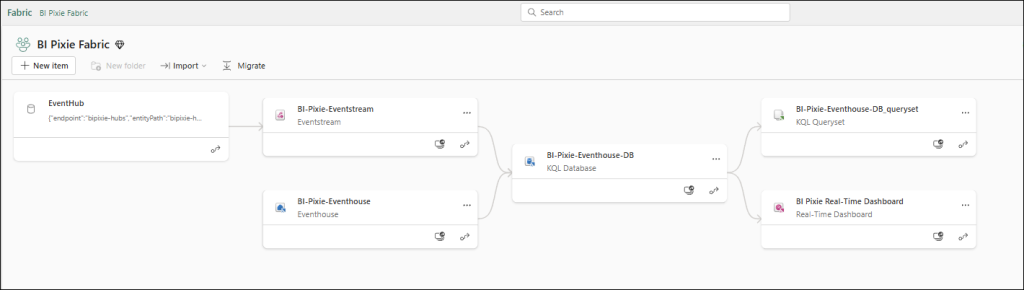
To deploy Fabric RTI dashboard, contact us for the instructions. The Fabric RTI components are available in a private GitHub repository that we can share on request.
Conclusions
BI Pixie brings together an all-encompassing auditing ecosystem that goes well beyond just tracking Row-Level Security. Its RLS auditing empowers organizations to uncover misconfigurations—such as overexposed or over-blocked access—and detect suspicious changes in real time. But BI Pixie doesn’t stop there. From analyzing export-to-Excel or CSV events to examining how users filter and interact with data, it provides holistic insights into how data is accessed and used across your Power BI environment.
This layered visibility not only helps tighten security by flagging potential data leaks and access escalations, but also drives smarter governance and adoption decisions. Whether it’s understanding which users export sensitive data, which data points gain attention, or where UI design impacts engagement, BI Pixie arms BI leaders and administrators with the intelligence they need to manage risk, compliance, and usability—all from a single, secure monitoring platform.
Because you own the alerts and data collected by BI Pixie, you’re free to integrate these insights directly into your existing data governance tools and processes. Whether you’re using Microsoft Purview, ServiceNow, or custom-built compliance workflows, the structured alert data from BI Pixie can be seamlessly connected to your broader governance ecosystem. This flexibility ensures that critical signals—like RLS violations, export events, or suspicious user behavior—can trigger timely actions, audits, or escalations across your organization, all while maintaining full control and ownership of your data.