Introducing AI Readiness in BI Pixie
BI Pixie now assesses whether your Power BI semantic models are ready for Copilot and Fabric data agents, drafts the context they are missing, and creates benchmarks to test your AI against answers computed from your own data. The first assessment of up to 500 semantic models is free on every plan.
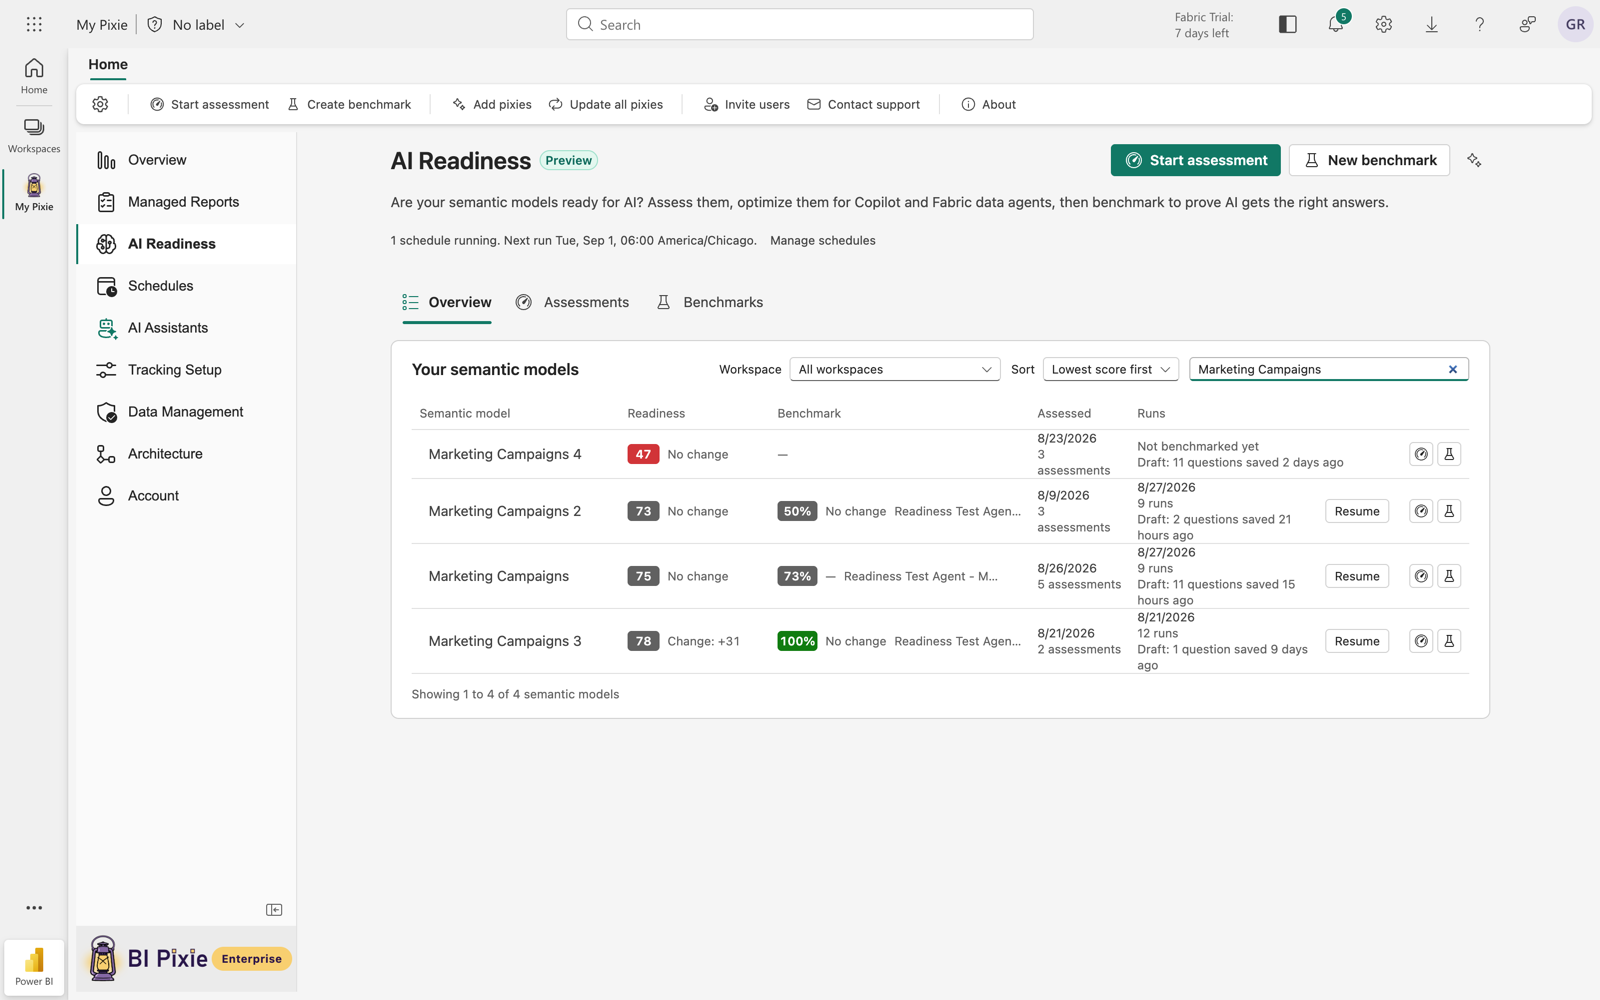
For two years BI Pixie has measured how people use your Power BI: who adopts a report and who stops coming, what they click, how satisfied they are, how fast reports load, and who saw what. Today we release the biggest expansion to BI Pixie to help you scale your AI investment and take your Power BI semantic models to production with Copilot and Fabric data agents. BI Pixie assesses whether your semantic models are ready for AI, drafts the context they are missing, and creates benchmarks to test your AI against answers computed from your own data.
Along with the expansion, we now offer a Free plan that assesses up to 500 semantic models, and a simplified flat pricing with no usage meters.
AI Readiness is available in BI Pixie Workload for Microsoft Fabric or in the cloud version. This post is the announcement. If you want the capability itself, see AI Readiness for Power BI Copilot and Fabric data agents.
Your semantic models already hold what AI needs
You have spent years building the dashboards and operational reports your organization runs on.
Then AI arrived, and with it a great deal of noise and confusion. You have read that dashboards are dead, that nobody will open a report again, and that everything will happen in a chat box. Real concerns were creeping in. What is the future of BI professionals in a world with no dashboards?
As time passes and AI evolves with it, you discover that your expertise is needed more than ever. AI needs business context, and your semantic models are the best foundation. The years you invested in building semantic models will make AI work on your data. You are now more essential than ever.
But how do you take AI to production? More and more requests land on your desk: connect our data to Copilot, stand up a data agent, let people ask questions in their own words. Make it work. Make it accurate. And it usually arrives with a date attached.
Three problems between you and production
A semantic model that has served people well for years can still require extensive effort before an AI agent can be trusted to answer from it.
A wrong answer by AI looks like a right one. An AI agent that lacks context does not report an error. It returns a confident answer that may be wrong, and the first warning is a number nobody recognizes in an executive review. And even worse, trusting the answers without catching the error can be devastating to your business.
How do you get AI Readiness at scale? Scoping the context down to what matters most for AI and resolving ambiguity takes many iterations on a single semantic model. Your teams may own many semantic models that are now being considered for AI, and the teams that can properly curate and optimize the semantic models are scarce.
Stay correct as semantic models change. A new measure without a description in the semantic model can break an AI agent that answered correctly last month, and nothing flags it before an executive reports it. How do you measure the accuracy of the AI agents and detect regressions and drifts?
What we announce today with the release of AI Readiness in BI Pixie is the solution to these challenges, and we think it can take your AI to production.
Assess a semantic model
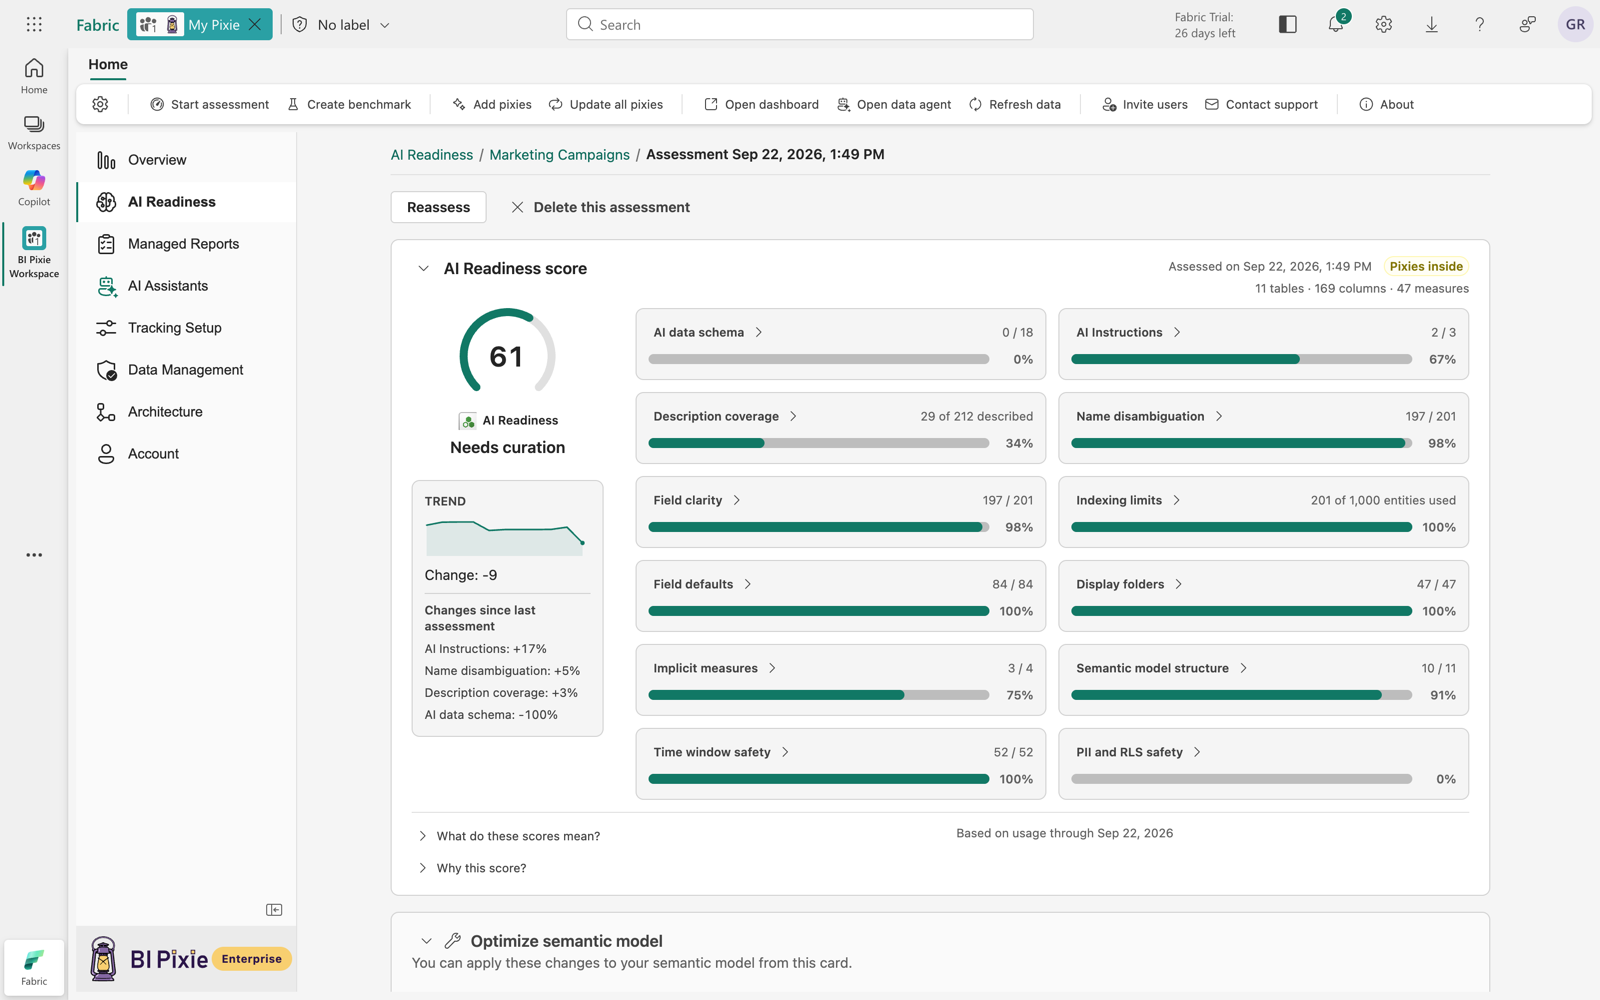
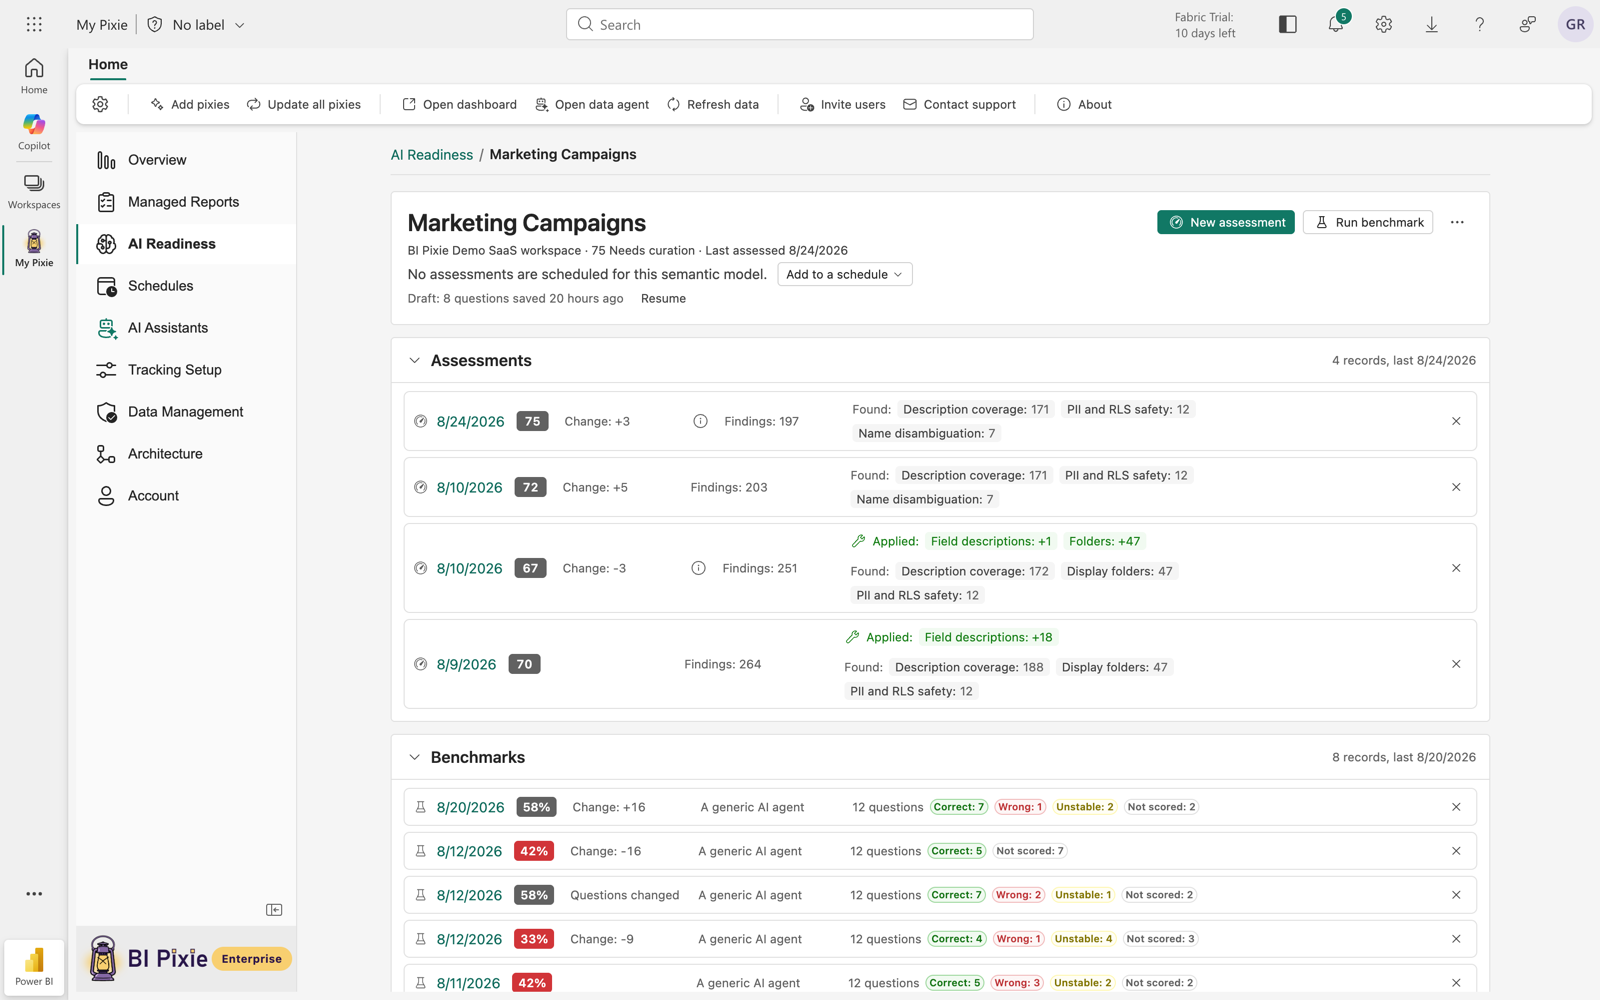
You point BI Pixie at a semantic model and it comes back with one AI Readiness score and a list of what is holding that score down. The scored dimensions behind it run from description coverage and colliding names to the AI data schema, AI Instructions, and implicit measures. BI Pixie reads the definition through the Fabric API using your own identity, so it can never see a semantic model you cannot.
Score Dimensions explains what each dimension measures and why it matters to Copilot or a data agent, and Assessments covers running one and reading the result.
Optimize your semantic models for AI
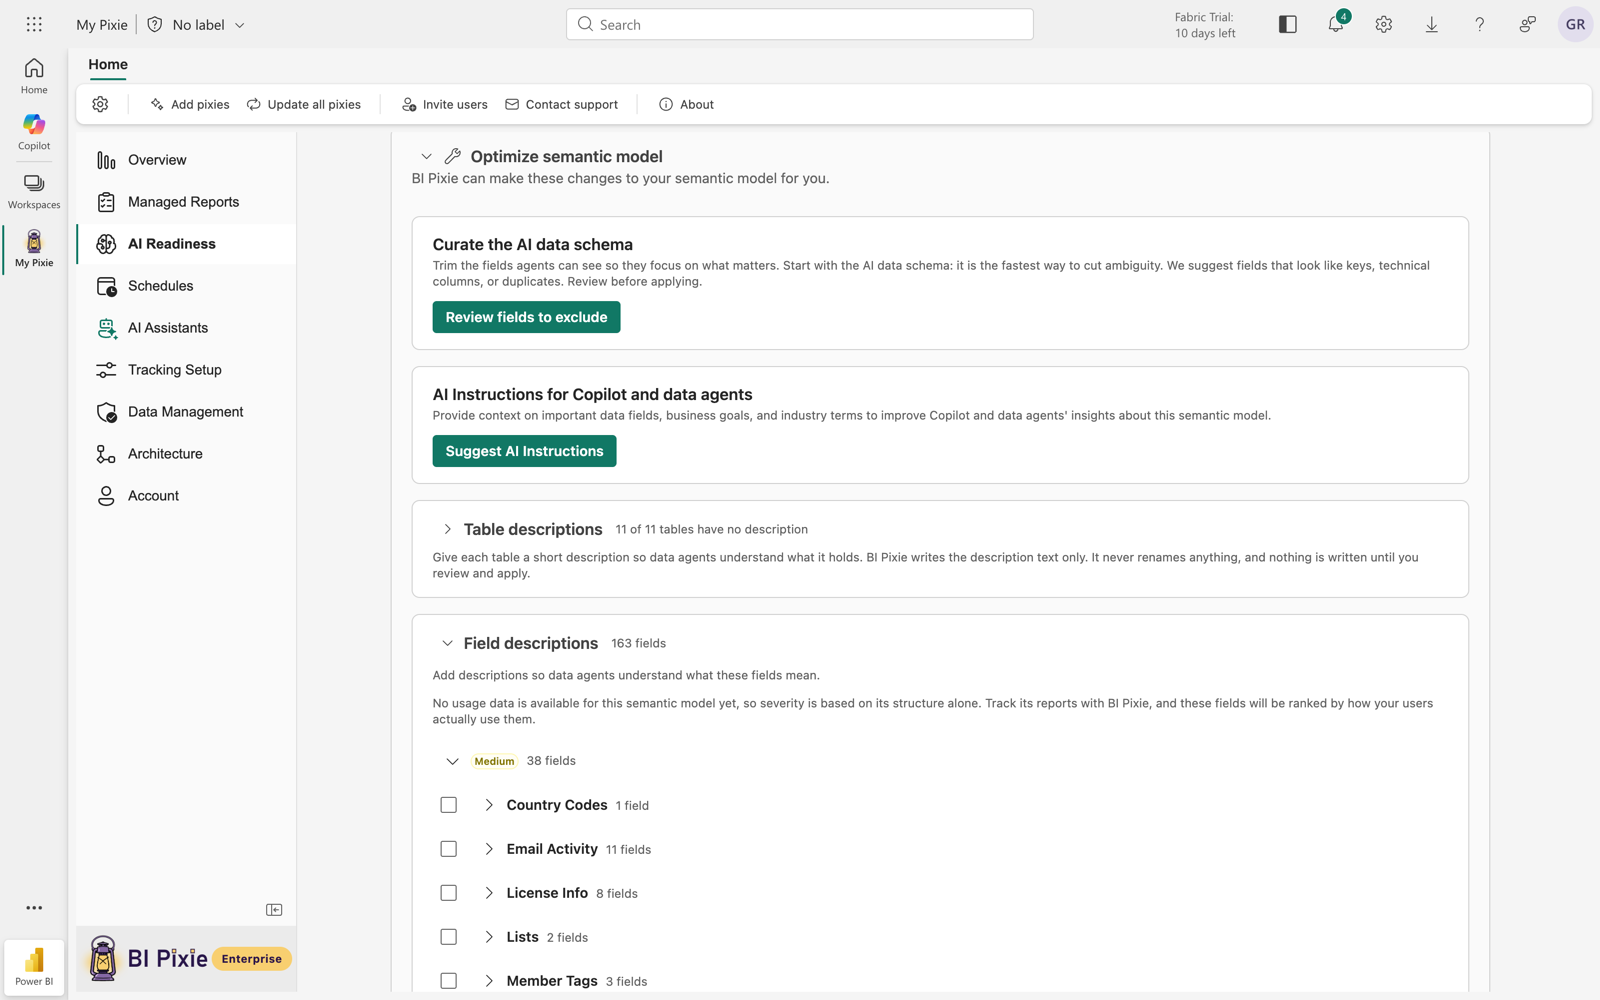
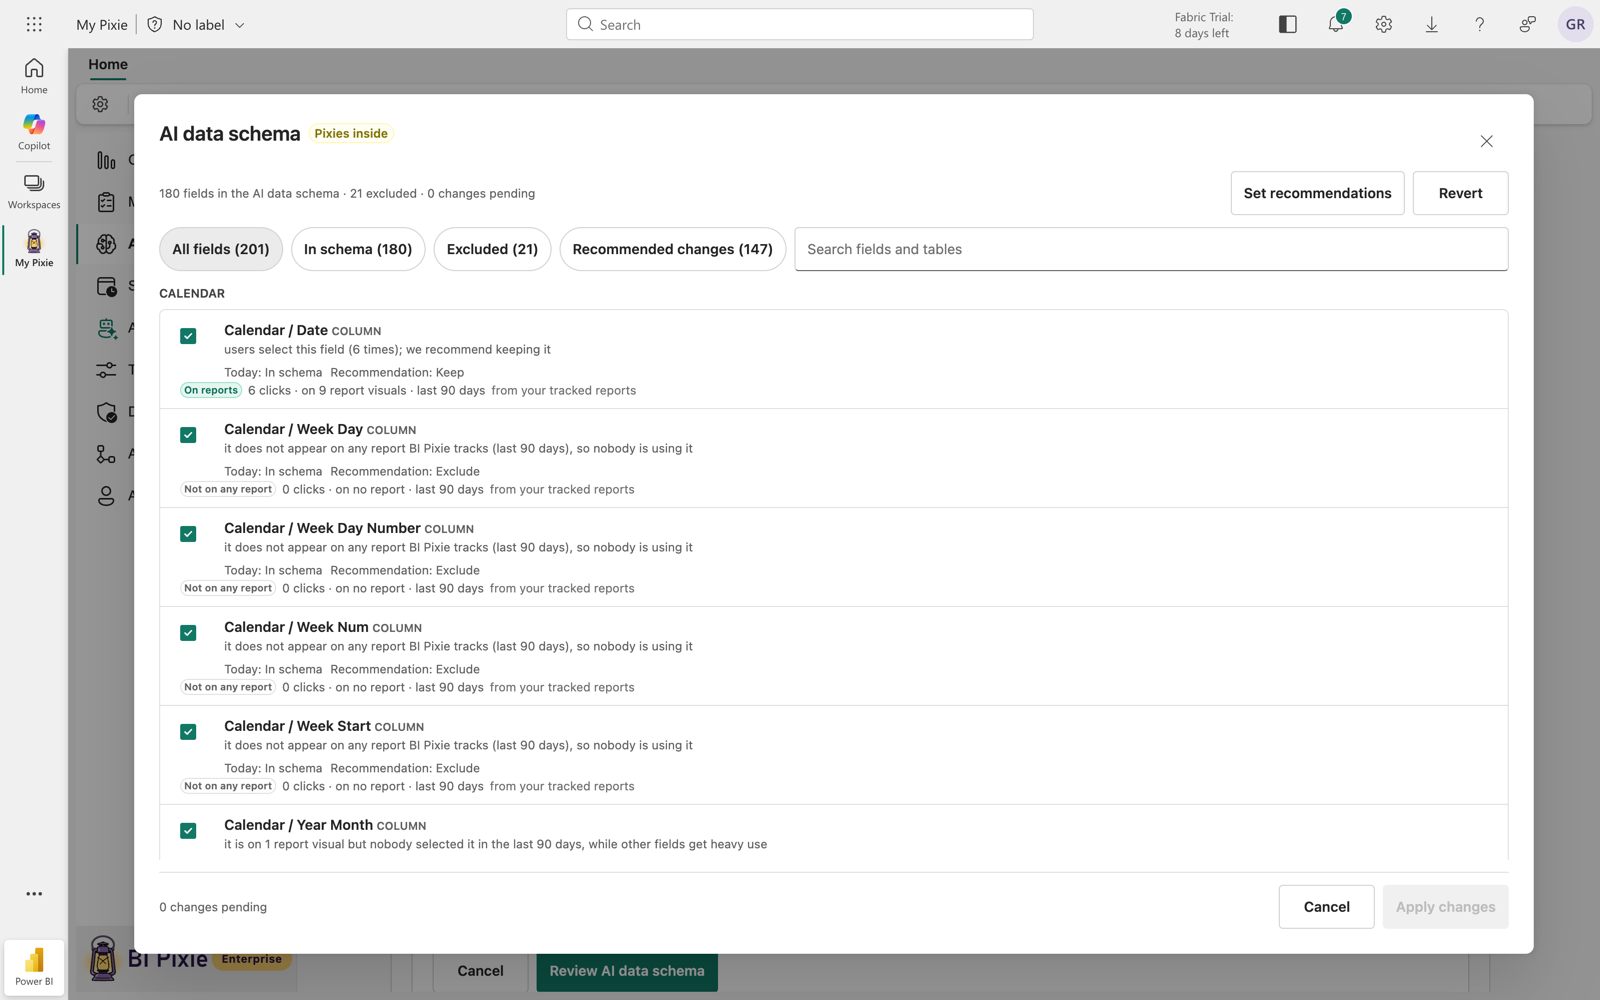
Most of what an assessment finds is missing or ambiguous context: descriptions nobody ever wrote, an AI data schema that still exposes helper tables, the instruction an AI agent would need to pick the canonical revenue measure. Writing all of that by hand takes time. Let’s take the AI data schema as an example. You can use Power BI Desktop or the Power BI service to define the AI data schema using the “Prep data for AI” feature. But how would you choose which fields to include when you may be dealing with thousands of fields? This is where BI Pixie comes to the rescue. If your reports have Pixies, BI Pixie tells you which fields get the highest number of clicks and which are used the most in visuals. With this information, BI Pixie recommends the fields to select.
For some of the recommendations, BI Pixie allows you to select an AI provider that will help you generate the AI Instructions and descriptions for fields. All the proposed optimizations can be edited, and nothing changes until you approve them.
Optimizations covers the fixes BI Pixie proposes, and AI Provider covers connecting one.
Benchmark the AI on answers you already know
An assessment tells you about the semantic model. A benchmark tells you about the answers, and the answers are what your stakeholders will judge.
A benchmark is an automated test you run to measure how accurately your AI answers from your semantic model. It comprises a set of business questions, each paired with the correct answer computed from your own data.
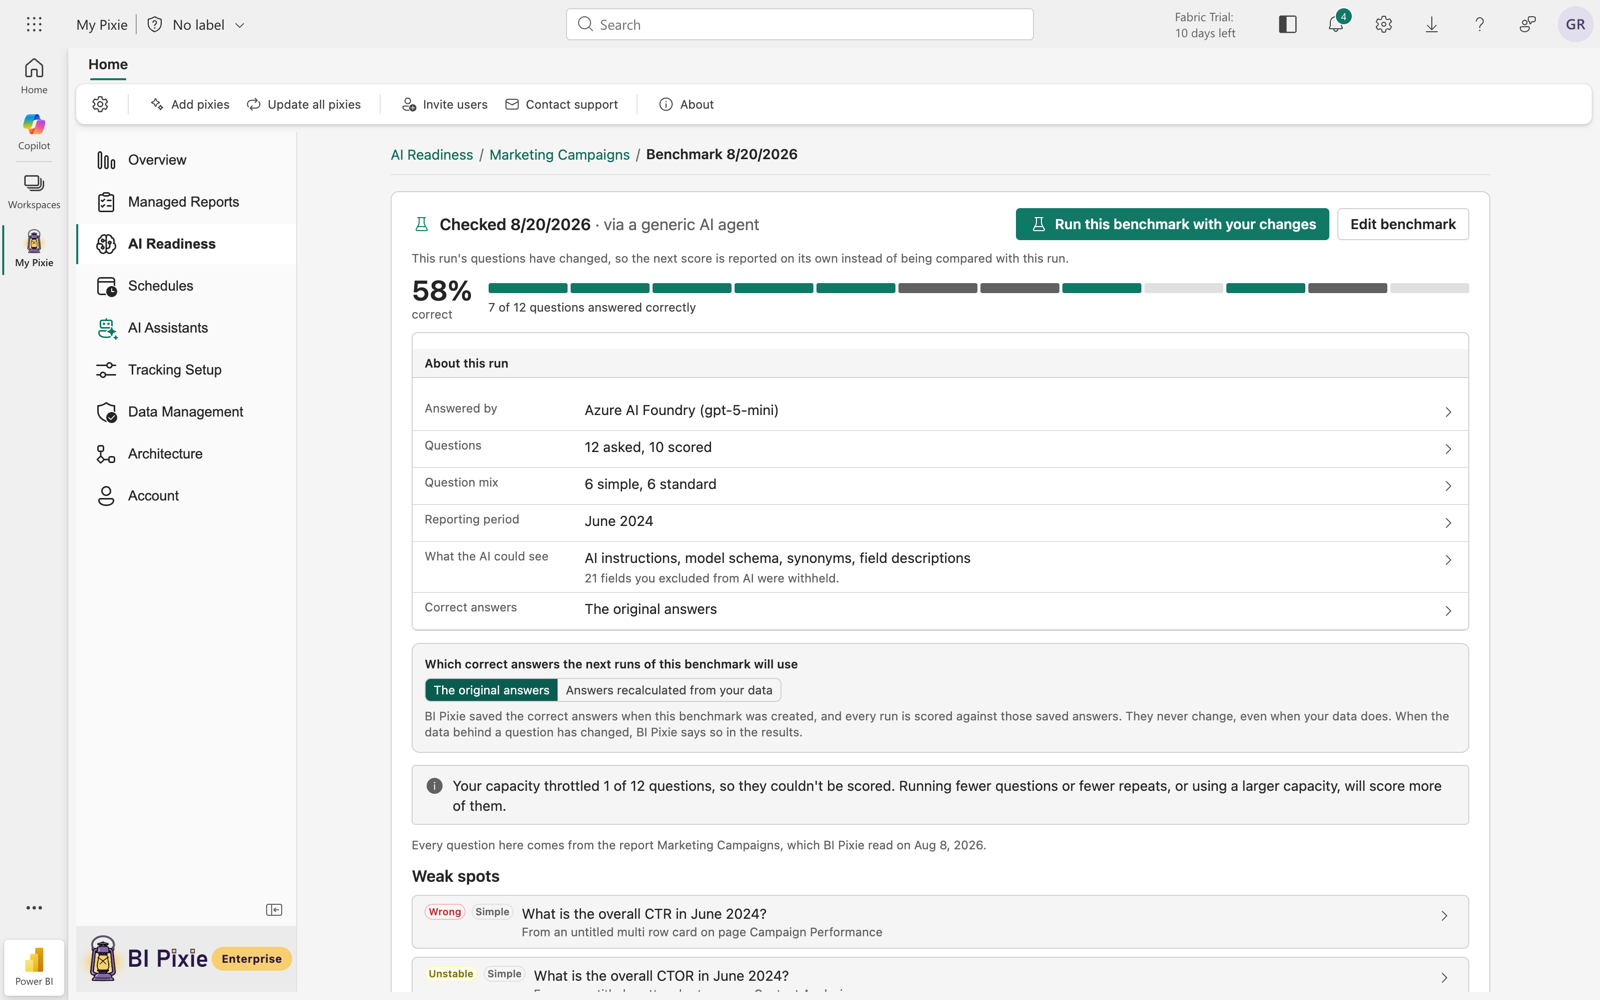
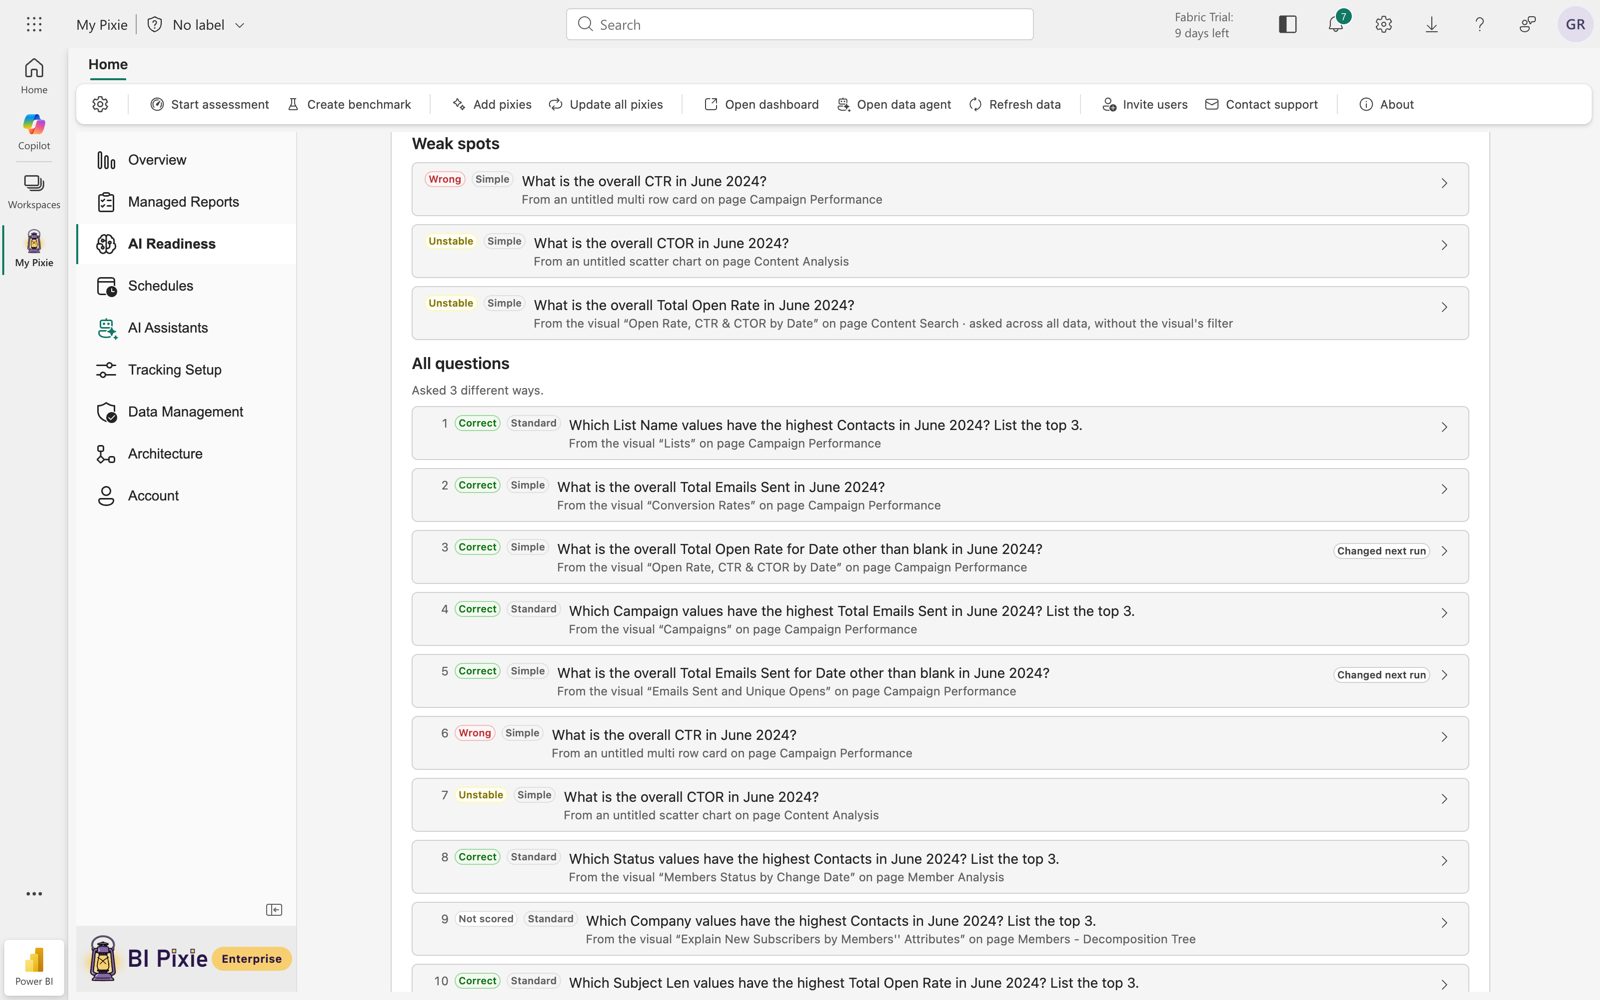
When the benchmark is ready, BI Pixie puts the questions to the AI you chose to test, grounded in your semantic model. It then checks every answer that comes back against the answer it prepared. What comes out is a score for how correctly that AI answers from your semantic model.
Building an effective test on your own is not easy, and it costs many hours, if not days. To help you scale that effort and automate the test, BI Pixie walks you through a series of steps.
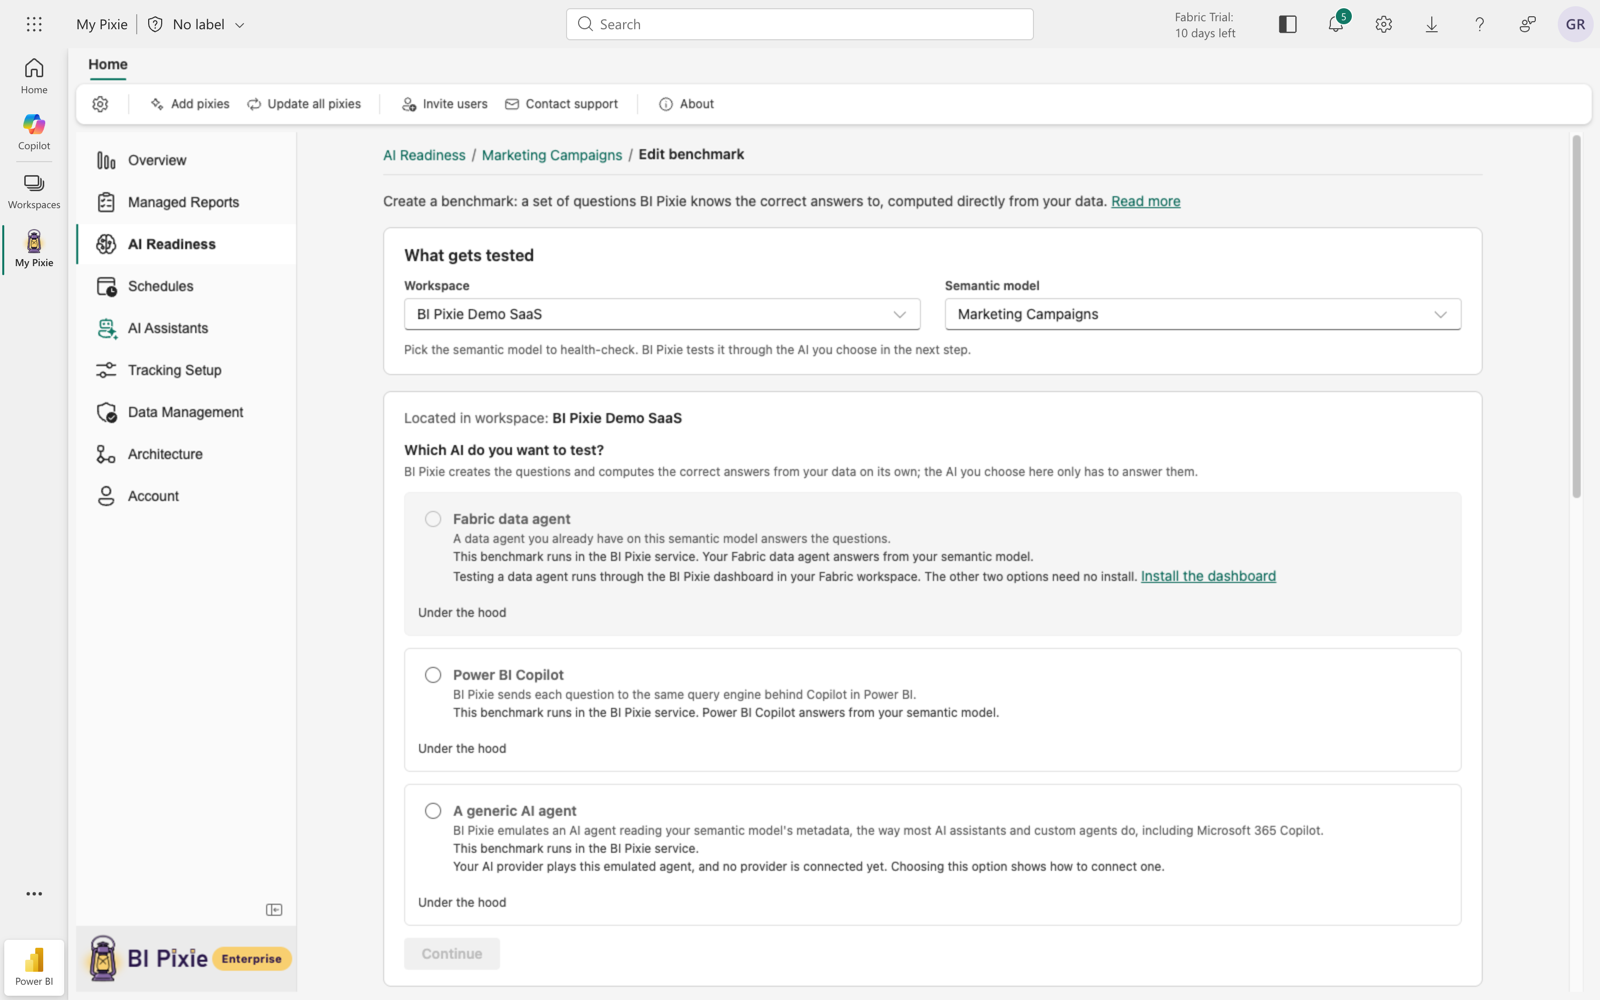
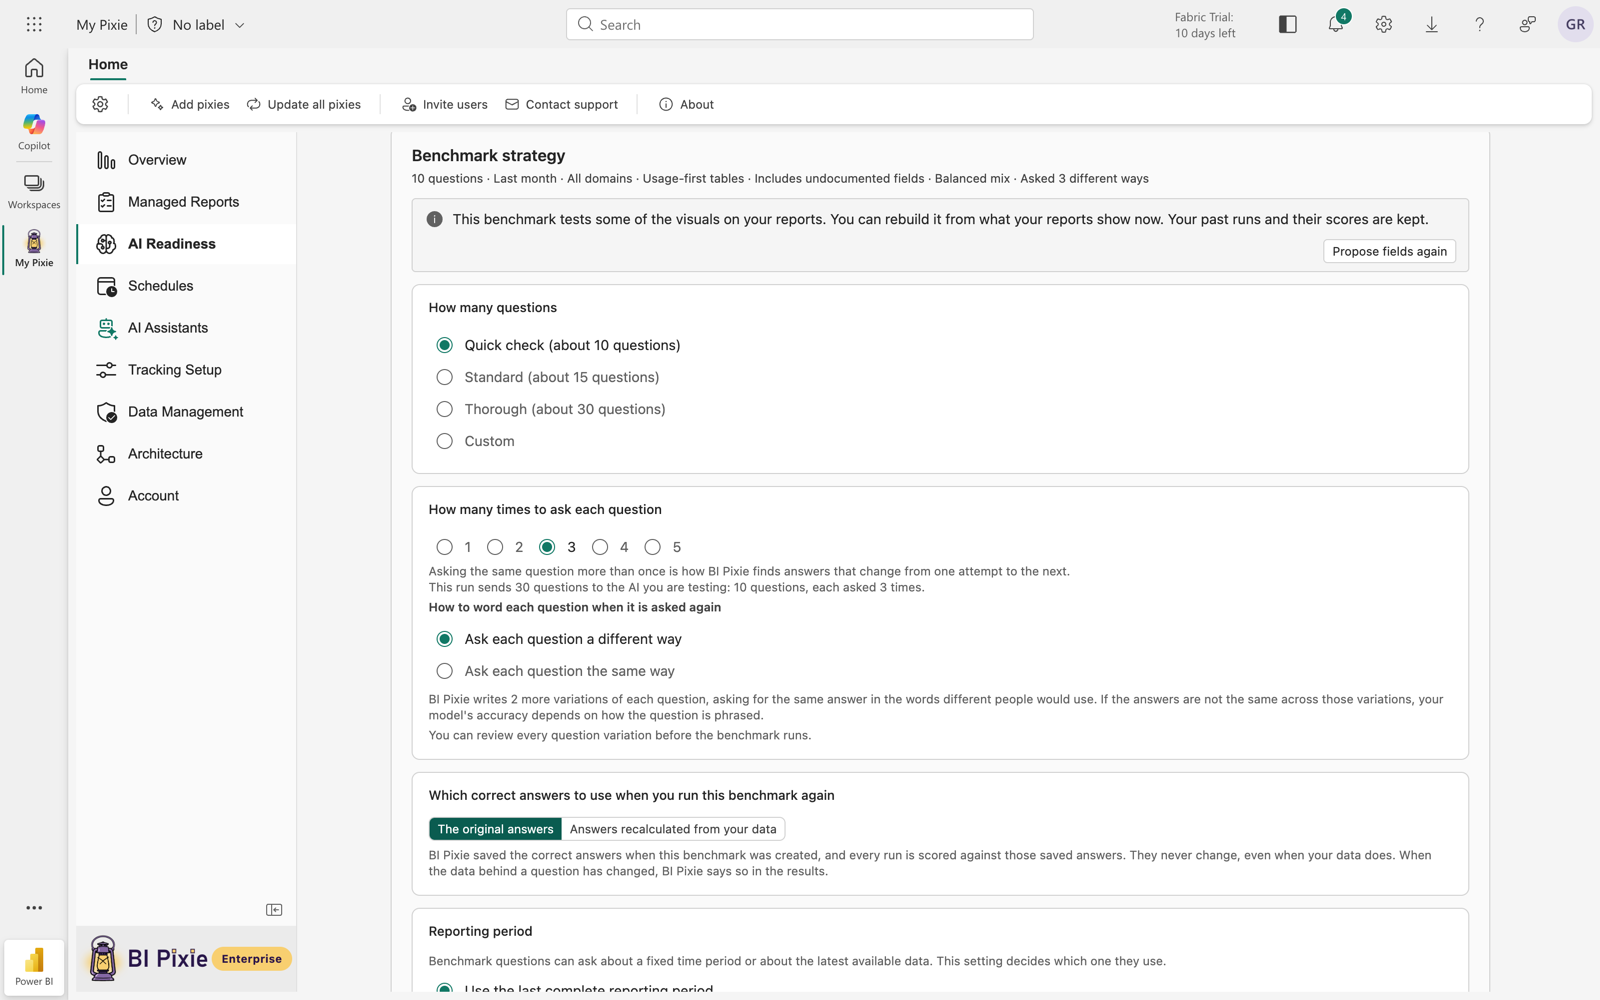
The first step is the strategy: how many questions the benchmark holds, which AI it tests, and how demanding those questions are. BI Pixie then proposes the fields that carry the most meaning in the semantic model, and draws question ideas from the visuals your reports already build on those fields. Every recommendation is yours to tune before the questions are generated.
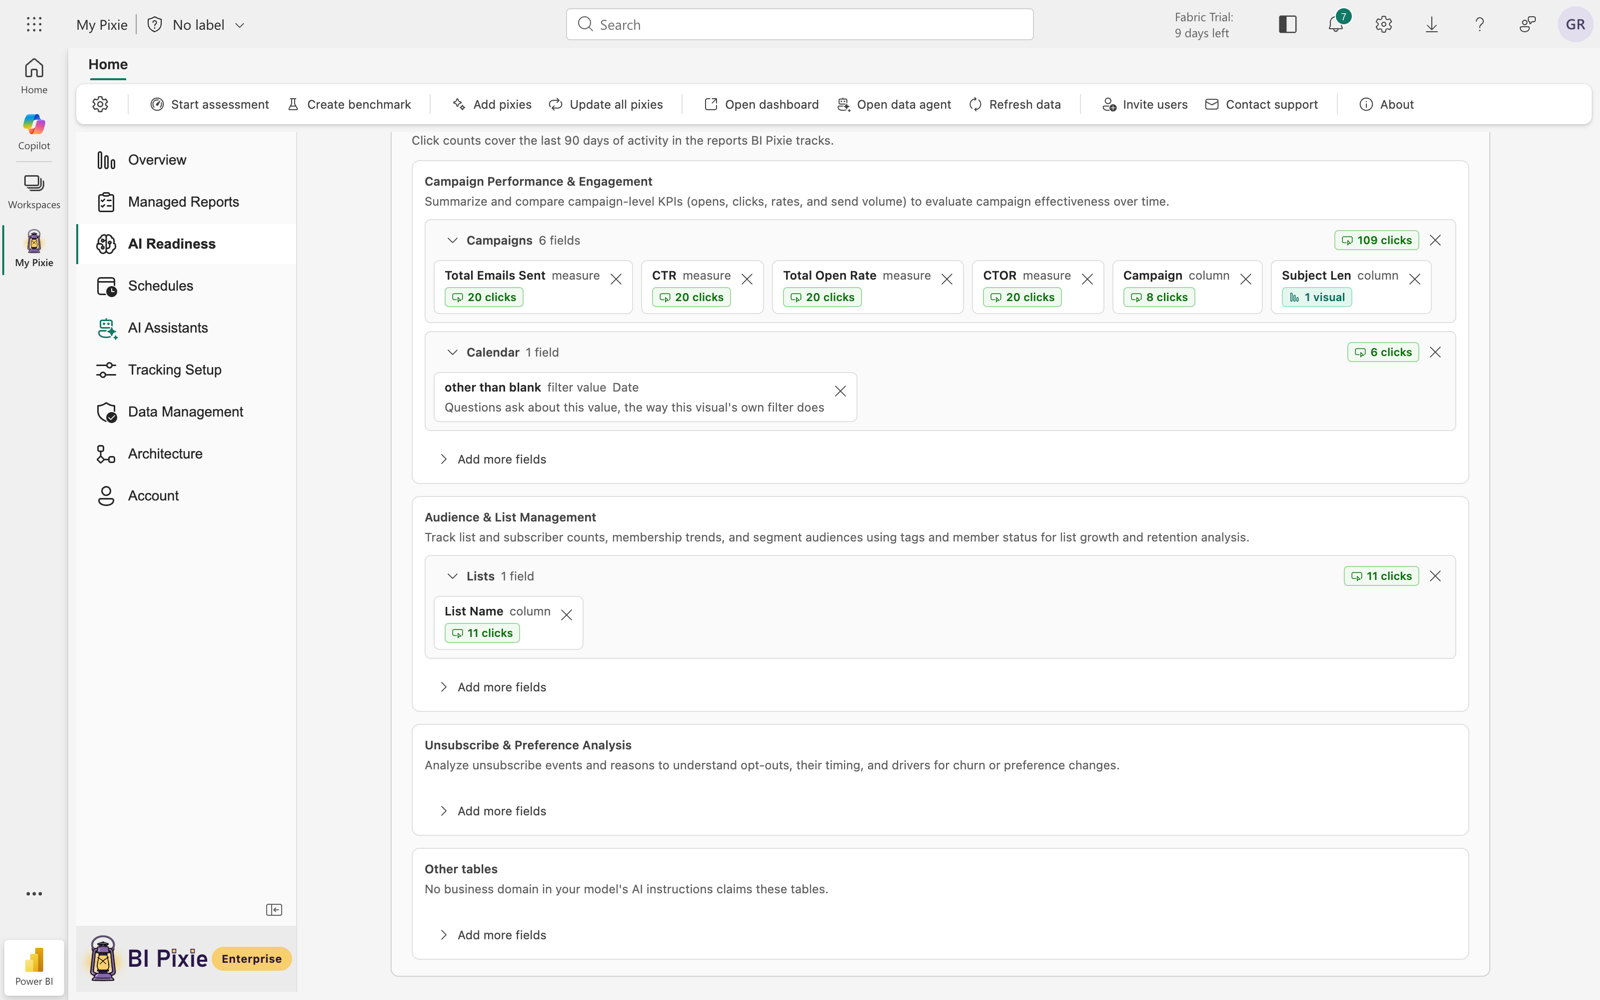
Once BI Pixie generates the questions in the benchmark, you can edit any of them, along with the DAX query that defines the correct answer. After you approve the questions and DAX queries, you save it and can run it at any time.
The next time you run the benchmark, after a round of optimizations or major changes in the semantic model, BI Pixie compares the result with the run before, so a regression caused by a change to the semantic model can be detected quickly rather than as a support ticket three months later.
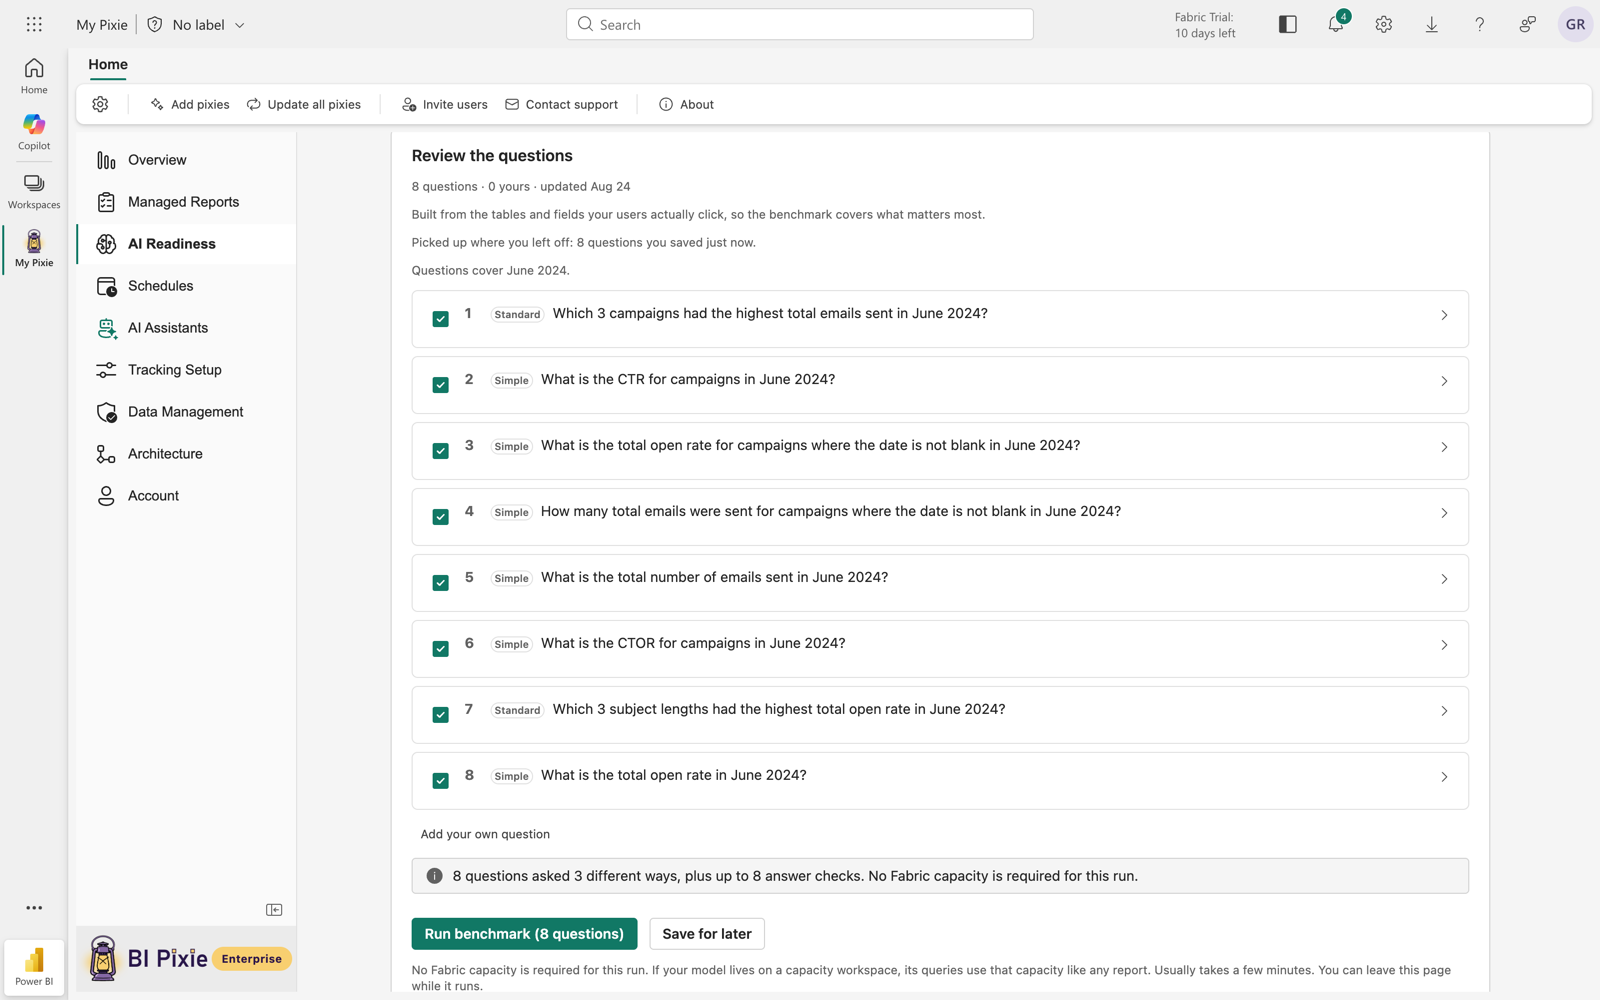
A great deal of thought has gone into keeping that comparison honest. How do you ask the same questions of the same answers when the data underneath keeps moving? BI Pixie handles it in two ways. The first is that every correct answer can be recomputed from current data before a run, using the DAX query saved with each question. The second is that the questions are scoped to a time period that has already ended, where the data is unlikely to change further.
AI to Test covers what each choice requires, Questions and Answers covers reviewing and editing the questions, and Run and Results covers reading a result and repeating a benchmark fairly.
A Free plan, and pricing that does not meter you
Two more things ship alongside AI Readiness.
Starting from today, there is no longer a 14-day trial period. You now have a Free plan!
Every BI Pixie account starts with the Free plan, in BI Pixie Cloud and in the Fabric Workload alike. You get an AI Readiness assessment of up to 500 distinct semantic models, one tracked report to measure usage, one tracked semantic model to optimize for AI as many times as you need, and one benchmark run on that semantic model.
Pricing is flat, by tracked items. A tracked item is a report you add Pixies to, or a semantic model you are preparing for AI. Your plan includes a set number of tracked items and nothing else is billed: no per-user fees, no usage billing, no overage charges. Pricing no longer moves with how much your reports are used.
| Plan | Price | Tracked items | Benchmark runs |
|---|---|---|---|
| Free | Free | 1 report and 1 semantic model | 1 in total |
| Standard | $149/mo | 10 | 3 in total |
| Pro | $499/mo | 50 | 100 per month |
| Enterprise | From $30,000/yr | 500, unlimited available | Unlimited |
Standard and Pro are two months cheaper if you pay annually. The Enterprise plan adds AI Readiness assessments on a schedule you set, so drift in a semantic model gets caught without anyone remembering to look. The pricing page carries the full comparison and the fair-use allowances.
What’s next
Learn more about AI Readiness for Power BI Copilot and Fabric data agents.
Start BI Pixie FREE plan today or if you prefer to run it on Fabric, ask your Power BI admin to approve the BI Pixie workload in the Fabric Workload Hub.