
Agentic and Programmatic Fabric Capacity Monitoring Using a Pro License
Capacity monitoring can be easy. Ask your agent what is driving utilization, which operations cost the most CU, and which items are barely used, and get the answers fast, with no extra load on your capacity.
Knowing what is consuming your Fabric capacity should be simple. Which items are heaviest, where utilization is climbing, who drove yesterday’s spike: these are everyday questions, and you should be able to ask them and get a clear answer in seconds.
The usual ways to read your capacity usage all run on a capacity, and all add to the very utilization you are trying to watch: Azure Log Analytics, Workspace Monitoring, or a notebook that pulls from the Capacity Metrics model with Semantic Link. Each has its place, for long-term retention, query-level diagnostics, or custom pipelines. But for the everyday questions, you do not need any of them. The same numbers can be queried by agents or programmatically on a Pro license, with no Premium, no XMLA, and no notebook, so a routine check costs you no capacity at all.
Ask your capacity in plain language
The fastest way to read your capacity usage is to not write DAX at all. We packaged the technique into agent skills, so in VS Code (with Claude Code, GitHub Copilot, Cursor, or Codex) you can ask about your capacity in your language and the agent writes and runs the query for you. Add the BI Pixie Skills alongside Microsoft’s skills-for-fabric, sign in once as a capacity admin, and ask away:
/plugin marketplace add DataChant/BI-Pixie-SkillsHere are three common questions you would want quick and accurate answers to.
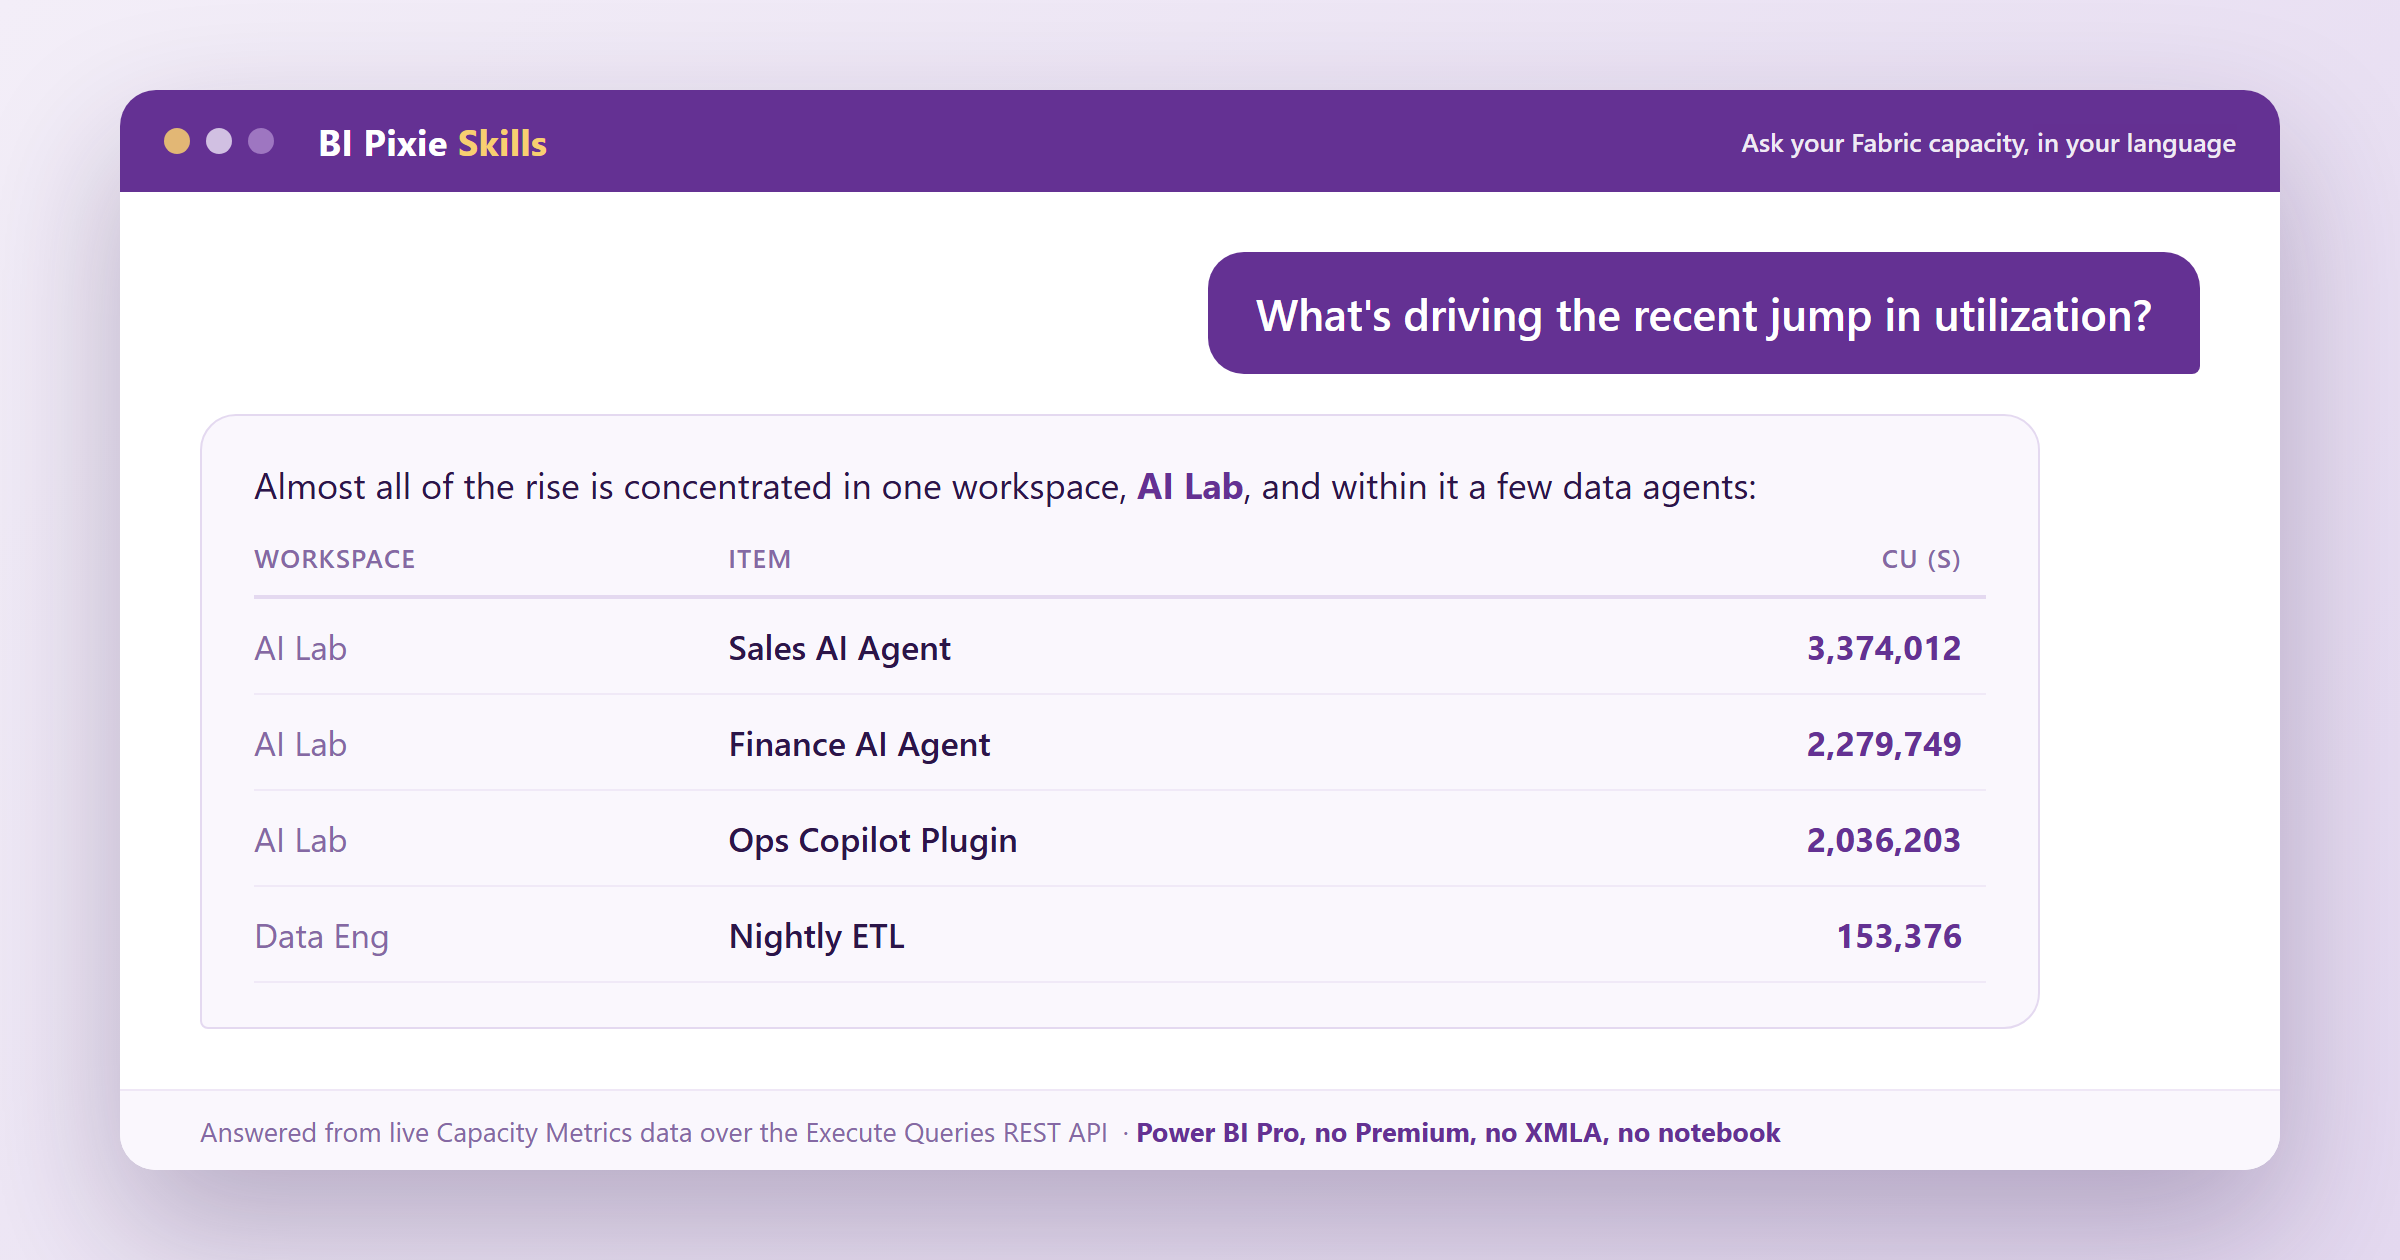
“What’s driving the recent jump in utilization? Break it down by workspace, then item.”
Almost all of the rise is concentrated in one workspace, and within it a few data agents:
Workspace Item Kind CU (s) AI Lab Sales AI Agent Data agent 3,374,012 AI Lab Finance AI Agent Data agent 2,279,749 AI Lab Ops Copilot Plugin LLM plugin 2,036,203 Data Eng Nightly ETL Notebook 153,376 The jump is almost entirely AI Lab’s data agents. Want the day-by-day trend, or the operations behind them?
“Which operations are using the most CU?”
By operation, your capacity is dominated by AI Query:
Operation CU (s) Operations AI Query 10,242,859 7,626 Ontology AI 610,328 260 Notebook Scheduled Run 265,142 66 Notebook Run 233,301 13 OneLake Other Operations 141,550 35,742 SQL Endpoint Query 13,649 56,055 Refreshes and OneLake I/O are minor next to the AI Query calls. Want these split by item, or by user?
“Which items cost the most CU but serve the fewest users?”
The heaviest items serve only a handful of people, prime candidates to optimize or schedule down:
Item Kind CU (s) Users Sales AI Agent LLM plugin 3,935,157 2 Finance AI Agent Data agent 2,705,830 2 Nightly ETL Notebook 414,167 2 Sales Lakehouse Lakehouse 212,790 1 Each burns serious CU for one or two users. Pair this with usage analytics to decide what to right-size.
In every case, you ask in your language and get an answer grounded in your own capacity data, broken down by workspace, item, operation, or user. The rest of this post is the technique the skills use under the hood, in case you want to run it yourself or build on it.
Important: the semantic models behind the Capacity Metrics and Chargeback apps are Microsoft apps in preview, and Microsoft documents them as supported only for the reports that ship inside the apps. Treat this as an unsupported, best-effort technique. The models can change without notice, so resolve them by name (not by ID) and expect to adjust over time.
What you need
- The Microsoft Fabric Capacity Metrics app and/or the Microsoft Fabric Chargeback app installed in your tenant. You must be a capacity admin to install them and to see your capacities’ data.
- The Fabric tenant setting “Semantic model Execute Queries REST API” enabled (Admin portal, Integration settings), or to be on its allowed list.
- To run the queries, sign in as a capacity admin with
az login. The examples below fetch the access token for you.
We have packaged everything below into BI Pixie Skills, an open-source repo with the agent skills, a model guide, and ready-to-run DAX for capacity health, cost, throttling, storage, and more. Read on for how the queries work, or grab them there and start automating.
Monitoring your capacities programmatically
Microsoft ships no API for capacity usage. No REST call answers the everyday admin questions: how much CU an item burned, what utilization looks like by item or by workspace, or who drove a spike. The numbers live only inside the Capacity Metrics and Chargeback apps, which Microsoft builds for their own reports. So to automate capacity monitoring, alerting, or chargeback, you query those apps’ semantic models yourself with DAX. That gap is what this post and the skills repo address: the queries, and the one syntax detail that makes them run.
To read the CU numbers, you set a single parameter, CapacitiesList, naming the capacity you want.
Here is the detail that trips everyone up: the parameter assignment must be wrapped in a
DEFINE block. A bare MPARAMETER line is rejected with “The syntax for ‘MPARAMETER’ is
incorrect.” With the DEFINE wrapper, the same query just works:
DEFINE
MPARAMETER 'CapacitiesList' = { "<your-capacity-guid>" }
EVALUATE
ROW(
    "CU", SUM('Metrics By Item'[CU (s)]),
    "Rows", COUNTROWS('Metrics By Item')
)
Once that returns numbers, you can shape the result like any other DAX query. Here is total CU by item over the retained window for one capacity:
DEFINE
MPARAMETER 'CapacitiesList' = { "<your-capacity-guid>" }
EVALUATE
TOPN(
    50,
    FILTER(
        SUMMARIZECOLUMNS(
            'Items'[Item name],
            'Items'[Item kind],
            'Items'[Workspace name],
            FILTER(Capacities, Capacities[Capacity Id] = "<your-capacity-guid>"),
            "CU_s", SUM('Metrics By Item And Day'[CU (s)])
        ),
        [CU_s] > 0
    ),
    [CU_s], DESC
)
Two practical notes:
- Scope by both the parameter and a filter. Setting
CapacitiesListand also filtering theCapacitiestable keeps the result tight and predictable. - Capacities outside your home region need one more parameter. Add
MPARAMETER 'RegionName' = "East US"(the capacity’s region) in the sameDEFINEblock, or its numbers come back empty. The home region works without it. - The schema changes between versions. The Capacity Metrics model is versioned, and column
names drift between releases (for example
Capacity Idversuscapacity Id). If you build something durable, detect the version or resolve columns defensively.
Chargeback: even simpler, and it knows the user
If you have the newer Fabric Chargeback app, reach for it first. Its model is fully
imported, which means there is no parameter to set and no per-capacity dance. One EVALUATE
over its single Chargeback table returns data:
EVALUATE
TOPN(
    50,
    FILTER(
        SUMMARIZECOLUMNS(
            'Items'[Item name],
            'Items'[Item kind],
            'Chargeback'[User],
            'Chargeback'[Experience],
            "CU_s", SUM('Chargeback'[CU (s)])
        ),
        [CU_s] > 0
    ),
    [CU_s], DESC
)
The Chargeback model adds two things Capacity Metrics does not expose to a simple query: the user who drove the consumption, and the experience (Analysis Services, Spark, ML, Kusto, and so on). It also keeps roughly 30 days of history instead of about 14. That makes it the cleaner source for “who and what is costing me CU.”
What it does not have is the capacity-health side of the story: throttling, utilization against your capacity limit, overages, memory, storage, and the 30-second timepoint detail all live in Capacity Metrics only. So the two models complement each other. Use Chargeback for cost attribution, and Capacity Metrics when you need to know whether a workload is actually pushing your capacity to its limit.
The quickest ad-hoc query: az rest
If you are a capacity admin and just want a quick answer, the Azure CLI is the shortest path. Sign
in once, and let az rest use your own admin credentials to fetch the token and POST the query to the
Power BI Execute Queries REST API.
Put the DAX in a small JSON file so the shell does not fight you over quoting:
az login   # sign in as a capacity admin

# query.json
# {"queries":[{"query":"EVALUATE ROW(\"CU\", SUM('Chargeback'[CU (s)]))"}]}

az rest --method post \
  --url "https://api.powerbi.com/v1.0/myorg/datasets/<datasetId>/executeQueries" \
  --resource "https://analysis.windows.net/powerbi/api" \
  --body @query.json
That is the whole technique for ad-hoc use: no SDK, no script, just your admin sign-in and one
command. The --resource flag tells the CLI to fetch a Power BI token; --body @query.json keeps
the DAX readable.
Running a query from PowerShell
For a scripted or repeatable run, acquire a token for the Power BI resource and POST your query:
$token = (az account get-access-token `
  --resource https://analysis.windows.net/powerbi/api `
  --query accessToken -o tsv)

$body = @{
  queries = @(@{ query = "EVALUATE ROW(""CU"", SUM('Chargeback'[CU (s)]))" })
  serializerSettings = @{ includeNulls = $true }
} | ConvertTo-Json -Depth 5

Invoke-RestMethod -Method Post `
  -Uri "https://api.powerbi.com/v1.0/myorg/datasets/$datasetId/executeQueries" `
  -Headers @{ Authorization = "Bearer $token" } `
  -ContentType "application/json" -Body $body
To find the dataset, list your datasets and match on the model name (Fabric Capacity Metrics
or Fabric Chargeback Reporting). Always resolve by name; the IDs change whenever the app is
reinstalled.
A note on the Capacity Metrics and Chargeback apps
Both are Microsoft preview apps, supported only for the reports inside them, so treat querying them as a best-effort technique: resolve the models by name (the IDs change when an app is reinstalled), and copy anything you want to keep into your own table, since the apps only hold a couple of weeks of detail. Everything here runs on Pro; each Execute Queries call returns up to 100,000 rows, which is plenty for aggregated CU. The one reason to reach for a Fabric capacity is to bulk-export the rawest 30-second detail at scale, which most teams never need.
Why we care
At BI Pixie we are obsessive about understanding how Power BI and Fabric are actually used, and cost is part of that picture. The same lightweight, no-Premium approach we use to surface usage insight applies cleanly to capacity cost: a couple of REST calls, no infrastructure, and you can see exactly which items and which users are driving your CU. If you want usage and engagement analytics for your Power BI reports to sit alongside this kind of cost visibility, that is exactly what BI Pixie is built for.
And because BI Pixie already publishes a read-only MCP server for its own engagement model, the same agent that reads your capacity cost can pull report usage right beside it, and answer the question that actually matters: not just what costs the most, but what costs the most for the least engagement.
One last thought. We have seen many organizations, and many seasoned experts, stuck in never-ending performance tuning to shave costs, instead of focusing on what matters most: generating higher value for the business. You deserve the best tools for both, performance and value creation. That is where BI Pixie comes in, pairing the capacity-cost visibility in this post with usage and engagement analytics for your Power BI content, so you can manage what things cost and prove what they are worth.