In this article, you will learn how to instrument your Power BI reports and add BI Pixies to track usage and engagement events from your audience.
Before you start
BI Pixie is an innovative solution that tracks and analyzes the usage, interactions, and engagement levels of your Power BI audience. The solution can scan the reports and inspect each report, page and visual for dynamic and static hyperlinks, filters, slicers, bookmarks, tooltips, and drill-through configurations. Then, BI Pixie instruments the reports and semantic models with invisible pixel-sized native report elements and measures that we call pixies (Why Pixies? Because they are a combination of pixels and invisible magical beings). The pixies are hidden from the users of your reports, but they are grouped and well-structured, so your BI team will be able to review them.
To start using BI Pixie Instrumentation, contact us using this form. We will reply with more information including the link to download 'bi-pixie.exe' and a license key.
Instrumenting the pixies in your Power BI reports can be integrated into your existing Power BI publishing process or CI/CD (if you have such process) and allows you to keep updating the reports whenever they change.
BI Pixie Instrumentation runs on Windows 64bit computer and receives a target folder and a configuration file as the input. You can bring the Power BI reports to the target folder in three ways:
- Manual or via external scripts: Use Power BI Desktop to convert Power BI report files (PBIX) to project files, or use other tools to extract the project files and place them in advance in the target folder. You can group different Power BI project files into sub folders.
- Using Git / GitHub: Integrate BI Pixie with your Git repository. BI Pixie Instrumentation will perform the pull request at the start of the run to import all the files locally. It can then optionally commit and push the instrumented reports to your Git repository and even sync the changes to your Power BI or Fabric workspaces. If you use the Git integration in Power BI workspaces, you don't need to convert PBIX report files to PBIP in your Git repository. Power BI does it for you (Learn more here).
- Via Microsoft Fabric API: Tell BI Pixie which workspaces to use. Include all the reports in the workspaces or specify which reports to include or exclude. BI Pixie will load the definitions of the reports and semantic models (Using Get Item Definition API call) and will store the files locally. Then, BI Pixie will instrument the reports and semantic models and update the report definitions in their corresponding workspaces. Learn more here.
Note: This approach is very effective if you use the Deployment Pipelines in Power BI. You can set BI Pixie to work on the Test stage while keeping the original reports in the Development stage. After you run BI Pixie, you can test the reports in the Test workspace in Power BI Service and then deploy the reports and semantic models in Production stage using the Deployment Pipeline. In BI Pixie configuration file, you can feed BI Pixie with many deployment pipelines by specifying their test workspace IDs.
When you run BI Pixie Instrumentation ('bi-pixie.exe'), it operates differently, depending on its configuration.
- First-run state: In the first run, BI Pixie Instrumentation does not have any configuration file. So, it will not modify any reports. During this run, BI Pixie Instrumentation creates the global configuration file with its default settings. In addition, the instrumentation creates an optional configuration file that will allow you to set specific configuration per report and override the global configuration. By default, all configurations are loaded from the global file.
- Instrumentation state: After you set up the configuration files, BI Pixie Instrumentation will add the pixies to your reports (and may integrate with Git and Power BI/Fabric service to update the modified reports). Every time you run BI Pixie Instrumentation again on the same target folder, BI Pixie will clean all previous pixies and add them again based on the latest definitions of the reports. For example, new pages, slicers, and bookmarks will be detected, and their corresponding pixies will be added to the report.
- 'bi-pixie.exe' has a special clean-only mode that allows you to run the instrumentation and clean all the pixies. This mode can help you clean most of the traces of BI Pixie (only minor traces will remain). To entirely clean the pixies, it is recommended to use source control against and revert the changes made by BI Pixie Instrumentation.
Running 'bi-pixie.exe'
Download 'bi-pixie.zip' from the link that we provided you in the trial instruction email. Unzip the file, and save 'bi-pixie.exe' in an X64 Windows 11 or Windows Server computer.
BI Pixie Instrumentation ('bi-pixie.exe') can be placed in the same target folder where you store all your Power BI project files. You can also assign the target folder as an argument.
If you run 'bi-pixie.exe' from the target folder as your Power BI project files, you can simply double-click on 'bi-pixie.exe' to start it. If you prefer to run 'bi_pixie.exe' through the command prompt or other scripts, follow these steps:
Launch the Command Prompt and enter the next two lines (one at a time):
cd [target folder path]
bi-pixie.exe
If the Power BI project files are in a different folder, you can enter the Power BI projects target folder separately, following this syntax:
bi-pixie.exe [target folder path]Here is an output of the first run when 'bi-pixie.exe' is located in the same folder as the Power BI project files. In the screenshot below, there are four reports in the folder, and 'bi-pixie.exe' returns descriptive output after the first run.
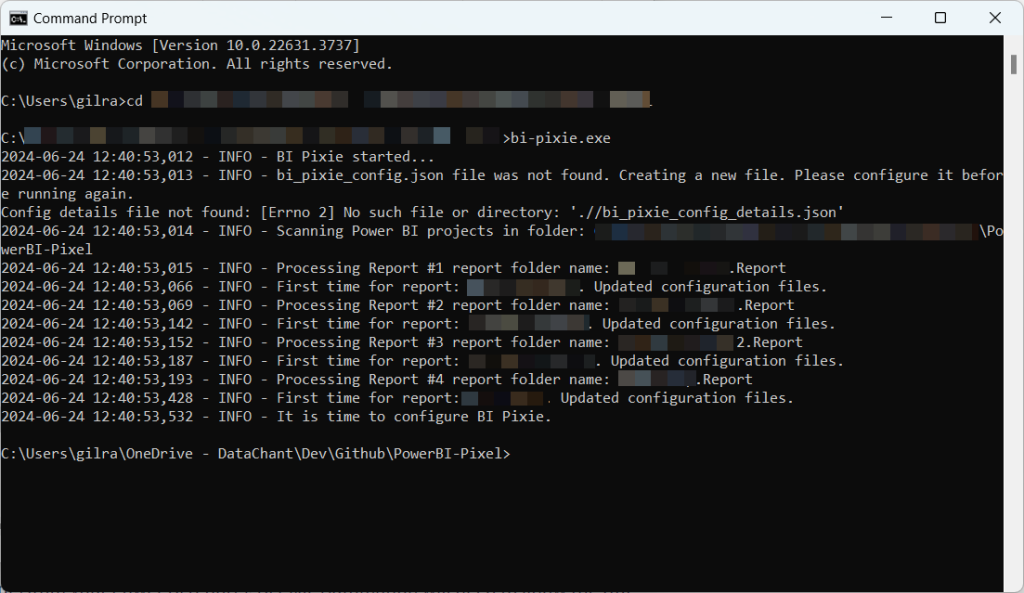
When the first run completes, 'bi-pixie.exe' generates two configuration files in the target folder. The files are:
- 'bi_pixie_config.json'
- 'bi_pixie_config_details.json'
To run BI Pixie Instrumentation, you will need to configure 'bi_pixie_config.json' using a text editor (e.g., using Notepad or Visual Studio Code) and update the parameters in the table below.
| Parameter name | Value | For example |
project_name | Enter a string here that can represent the Power BI reports in the target folder. It can be your company name, your team's name, a business unit, or a project codename. You are not expected to change this value unless you have a different target folder with different Power BI project files you want to instrument. | "project_name: "finance reports" |
subscription_email | Enter the email you used when you registered for the BI Pixie trial or paid subscription. | "subscription_email": "bob@acme.com" |
license_key | Enter the license key that you received from us during registration. | "license_key": "12345678-ab12-123b-4444-12345678abcd" |
pixies_flow_endpoint_url | This is the URL of the BI Pixie component that you deployed in your Azure or Power Platform account that listens to usage and interaction events from end-users. In Enterprise deployment, the same URL collects inventory data when you scan the reports. If you use the Starter deployment version of BI Pixie, enter the full web trigger URL from BI Pixie Web Trigger (as described here). If you use the Enterprise version, enter send_event function URL (as described here). | Example: Starter deployment: "pixies_flow_endpoint_url": "https://prod-*.logic.azure.com:443/*"Enterprise deployment: "pixies_flow_endpoint_url": "https://[your-function-app].azurewebsites.net/api/send_event?code=[your function app key]" |
pixies_inventory_flow_url | This is the URL of the BI Pixie component that you deployed on your Power Platform account that listens to inventory data. If you use the Starter deployment of BI Pixie (Power Platform), enter the full web trigger URL from the cloud flow BI Pixie Web Trigger Inventory (as described here). If you use the Enterprise deployment, you can delete this parameter or keep it as-is. It will be ignored. | "https://prod-*.logic.azure.com:443/*" |
starter_deployment | Set to true if you use the Power Platform deployment. Set to false if you use the Azure deployment | "starter_deployment": false |
Here is the default 'bi_pixie_config.json' before the configuration:
{
  ...
  "subscription_email": "Enter the email address you provided for the trial or subscription]",
  "license_key": "[Enter the license key you received from us]",
  "project_name": "[Enter your project name. This can be your team or your business unit or how you would label the set of reports you want to track]",
  "pixies_flow_endpoint_url": "[Enter the endpoint url]",
  "pixies_inventory_flow_url": "[If you use Starter deployment, enter the endpoint url of the inventory cloud flow]",
  "starter_deployment": false,
  ...
}
Here is an example of the Json file after you configure it to run it using the Azure deployment:
{
  ...
  "subscription_email": "bob@acme.com",
  "license_key": "12345678-ab12-123b-4444-12345678abcd",
  "project_name": "finance reports",
  "pixies_flow_endpoint_url": "https://[your-function-app].azurewebsites.net/api/send_event?code=[your function app key]",
  "pixies_inventory_flow_url": "https://prod-*.logic.azure.com:443/workflows/*/triggers/manual/paths/invoke?api-version=2016-06-01&sp=%2Ftriggers%2Fmanual%2Frun&sv=1.0&sig=*",
  "starter_deployment": false,
  ...
}
Here is an example of the Json file after you configure it to run on the Power Platform deployment:
{
  ...
  "subscription_email": "bob@acme.com",
  "license_key": "12345678-ab12-123b-4444-12345678abcd",
  "project_name": "finance reports",
  "pixies_flow_endpoint_url": "https://prod-*.logic.azure.com:443/workflows/*/triggers/manual/paths/invoke?api-version=2016-06-01&sp=%2Ftriggers%2Fmanual%2Frun&sv=1.0&sig=*",
  "pixies_inventory_flow_url": "https://prod-*.logic.azure.com:443/workflows/*/triggers/manual/paths/invoke?api-version=2016-06-01&sp=%2Ftriggers%2Fmanual%2Frun&sv=1.0&sig=*",
  "starter_deployment": true,
  ...
}
To activate some of features in BI Pixie such as Feedback collection, The Visual Clicks Heatmap, and Workspaces context, please continue reading the user guide. For a full reference of the configuration of BI Pixie read this article.
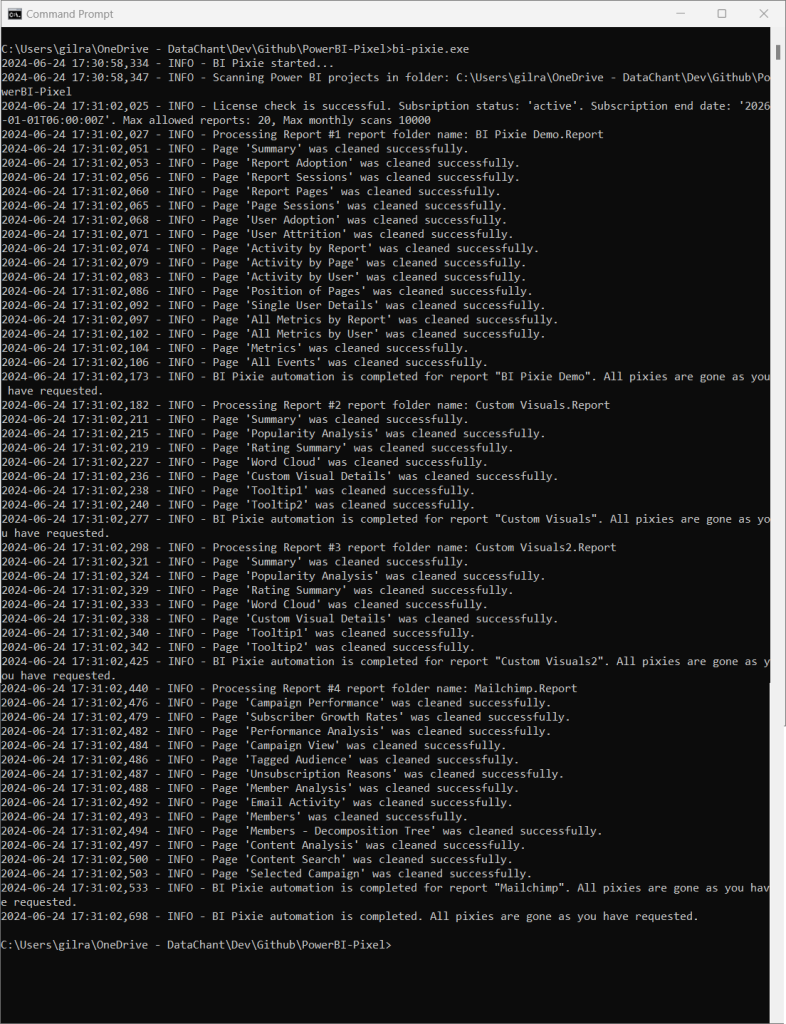
Save 'bi_pixie_config.json' and run 'bi_pixie.exe' again as shown above. This time, BI Pixie Instrumentation will scan the reports and instrument the pixies. You can read the progress and instrumentation results in the console.
When the run ends, you can view the log files that are created in the logs subfolder:
'bi-pixie.log' includes ERROR and INFO level logs.
'bi-pixie-debug.log' includes DEBUG, ERROR, and INFO levels of logs.
If the instrumentation fails with errors, you can submit a support ticket here and send us the error logs, so we could resolve the issue faster.
Each consecutive run of 'bi-pixie.exe' will clean the Power BI report files from the pixies of the previous run and will add new pixies to reflect the new report definitions. New logs will be appended to the log files above.
The second file, 'bi_pixie_config_details.json', allows you to disable or configure specific features at the report level. You can learn more about the configuration files and their different parameters in this article.
What's Next
Instrument your reports with Git
Instrument your reports with Fabric API