At this stage you have already run BI Pixie Instrumentation and the pixies were added to the Power BI project files. It is time to test that BI Pixie tracks usage from these reports.
Audit the changes
Before you publish the reports, you can use source control tools like GitHub to inspect the changes in the semantic models and reports. While it is not required to inspect the changes, it is recommended to do so. If you use source control tools with your Power BI project files, we recommend you follow these best practices:
- Check for errors in bi-pixie.log. If you see the line "INFO – BI Pixie Instrumentation is completed. The pixies are ready to track user engagement in your Power BI reports." and if there are no "ERROR" lines in the log file, commit the changes in your source control tool and proceed to step 3.
- In case of errors, use the source control tool to revert back the changes and contact us if the error message is not clear and actionable.
- In case there are no errors, view the pixies in your source control tool and publish the modified reports and semantic models using Power BI Desktop publish command or through the supported API or source control tools.
We designed BI Pixie to keep a striking balance between three needs. First, the consumers of the reports should have a seamless experience without noticing the pixies in their reports. Second, your report developers should be able to keep working on the reports without interruption by the pixies. Third, your team should be able to review the pixies and audit the reports to ensure that the instrumentation works as expected.
To implement the needs above, the pixies were implemented using two elements:
- Table visuals that are stored in one of the four corners of the report pages with a width and height of one pixel. Every report page can have multiple tables. These tables are all stacked on top of each other and are grouped together.
- Dynamic measures that are stored under the same folder and are all set as hidden measures.
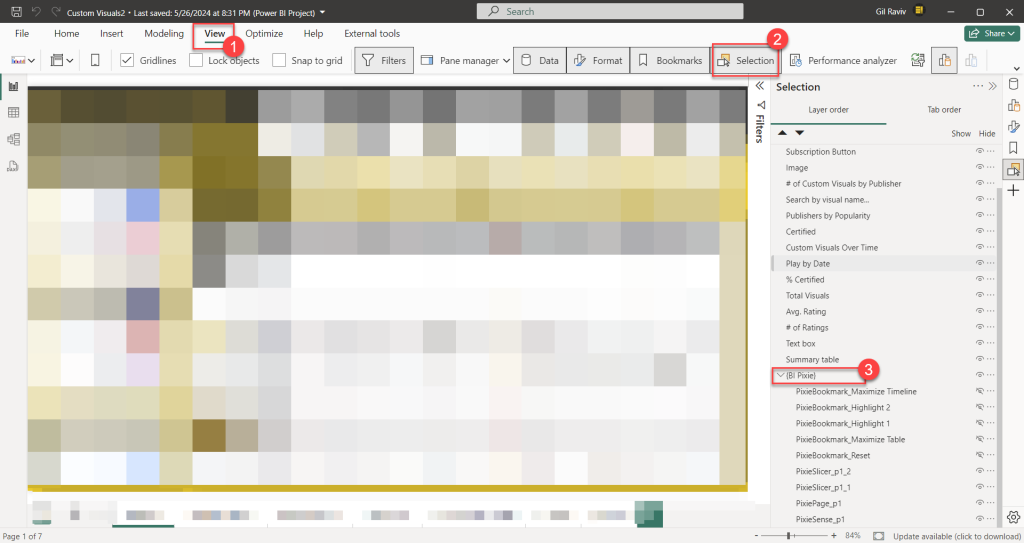
Let's show you how you can find the pixies using Power BI Desktop. Open one of the instrumented Power BI project file with Power BI Desktop. Select the View tab, and open the Selection pane. At the bottom of the Selection pane you can find a group of visuals that are named {BI Pixie}. Expand that group and explore the pixie visuals.
Select one of the visuals under {BI Pixie} group. You can now open the Build pane to see that the visual is a table visual. In the Format pane under Visual tab, expand the Size and position. You can now see that the visual's width and height are set as 1 pixel.
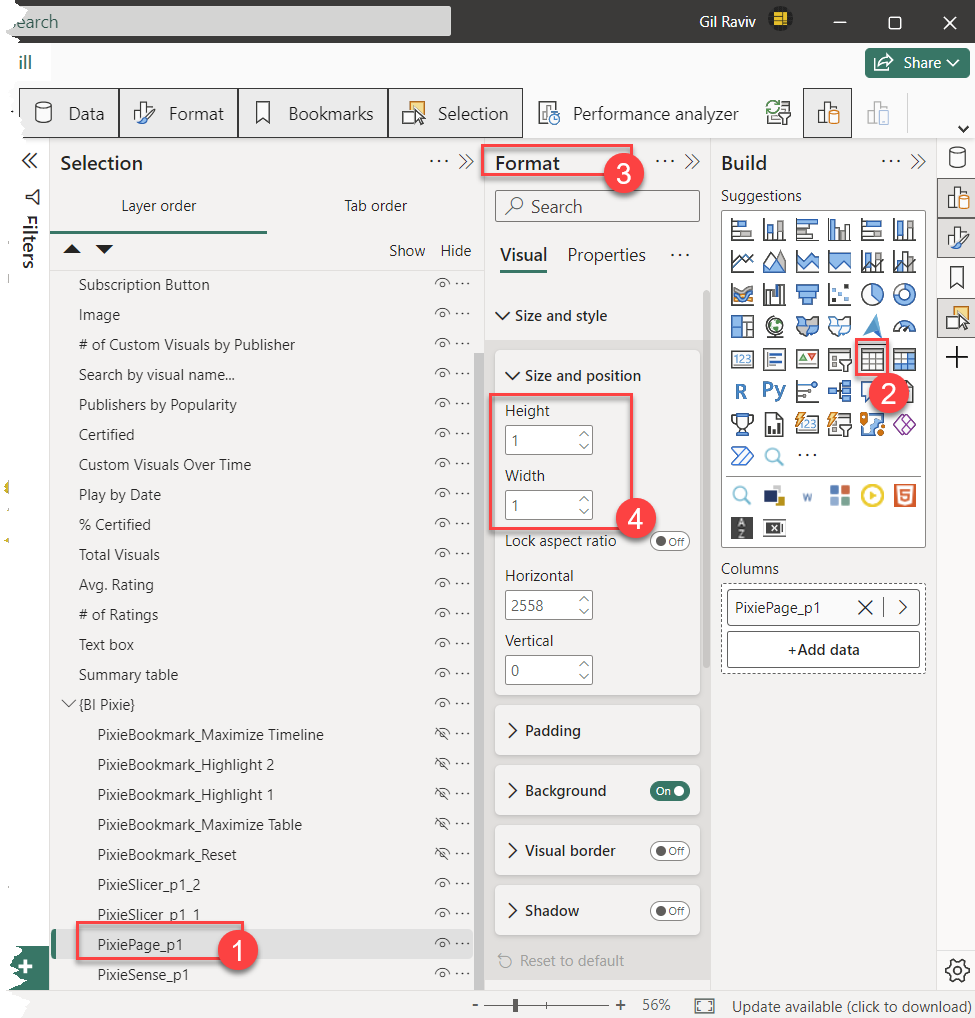
Open the Build pane of one of the pixie visuals under {BI Pixie}. You can see that is has a measure under Columns section.
Open the Data right pane, and click the ellipsis of the first table. In the drop-down menu, select View hidden.
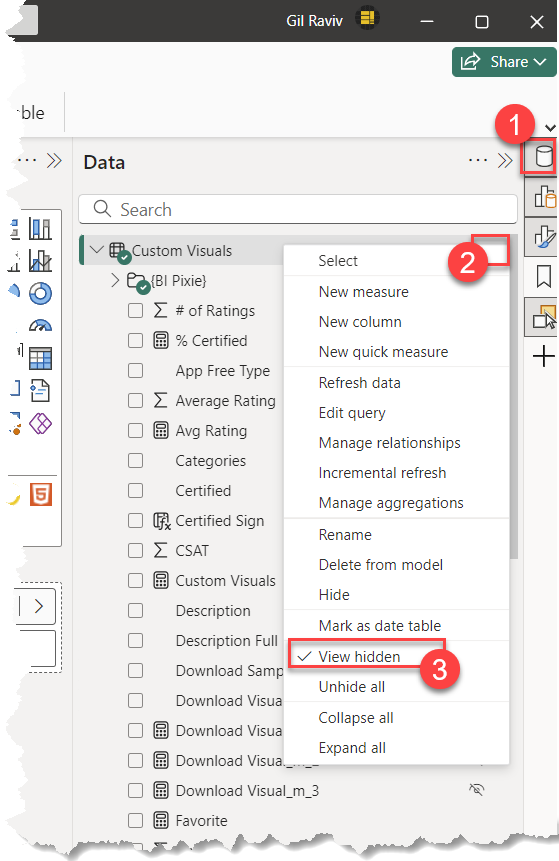
Expand the first table in the Data pane and find {BI Pixie} folder. You can expand {BI Pixie} folder to view all the hidden measures that BI Pixie Instrumentation has added.
Note: In bi_pixie_config.json file, you can select a different name to use instead of {BI Pixie} for the visual group and measure folder that were mentioned above. Read more here.
You have learned how to find the pixies in Power BI Desktop. Now, let's see how you can track the events in BI Pixie Events dataverse table.
Verifying that raw events are stored
You can verify that the instrumented reports are been tracked by BI Pixie by looking at BI Pixie storage.
Verify the events in Power Platform deployment
Go to https://make.powerapps.com, and in the environments drop down select the environment you use (as was described here). Select Tables on the left sidebar. Select All, and enter BI Pixie in the search bar. You will find BI Pixie Events. Click on that table.
Click Edit.
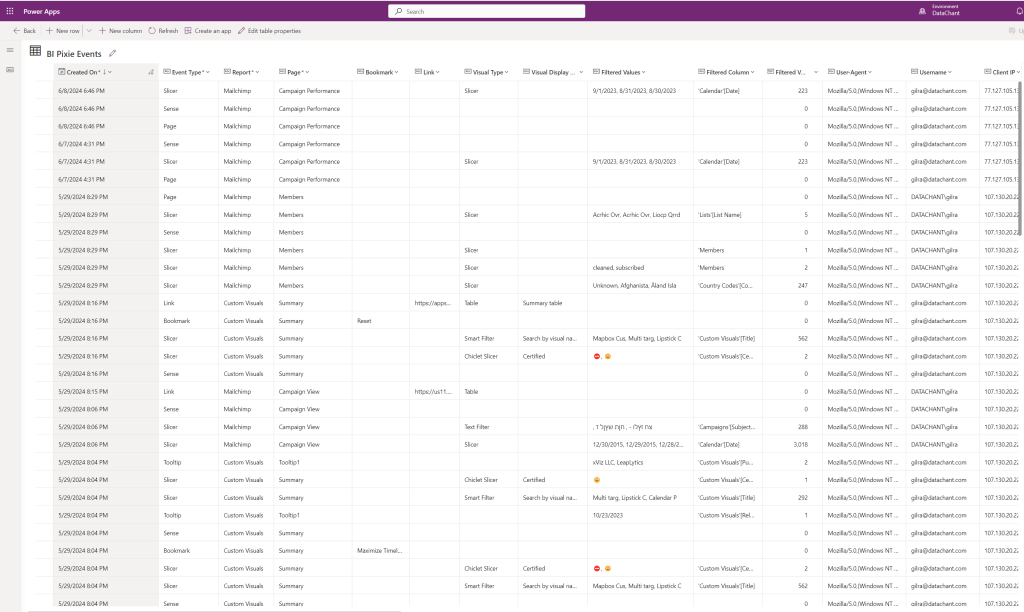
Sort the table by Created On column in descending order. Verify that you see records with your report name. The Report field will include the name of your report. The Page field will include the first page. The Username field will include your user name in a Domain\user format.
Now move to the second page in the Power BI Desktop and refresh the BI Pixie Events dataverse table to ensure that the second page is tracked.
If you don't see any events in BI Pixie Events table, go to BI Pixie Web Trigger cloud flow and check the run history for errors. Go through this guide from the beginning and confirm you didn't miss any step. Need help? Contact us here for support.
If you see the events in BI Pixie Events table, you can now test if the events are tracked when the report is consumed in Power BI service. Publish the instrumented report to the Power BI service and open the report in its workspace. Navigate through the pages and interact with the visuals, slicers and bookmarks. Check the BI Pixie Events table and confirm you see new events. This time, the events will include your email address in Username column.
Verify the events in Azure deployment
After you open and interact with one of the instrumented reports, you can verify that the events are collected an stored using Microsoft Azure Storage Explorer or Azure Portal. Open the BI Pixie storage account that you deployed and follow these steps:
- Open
bipixielakecontainer. - Open the folder with your license key as its name.
- Open
inventoryfolder. - Open the folder that is named as your project name (As you defined it in
bi_pixie_config.json). - Open the latest json file and confirm it contains your instrumented reports.
- Go back to the parent folder with your license key as its name.
- Open
eventsfolder. - Open the sub folder that is named as the workspace or project name.
- Open the sub folder that is named as the report name
- Open the sub folder that is named as the user
- Open the latest .tsv file and find logs at the end of the file with data that matches your interactions.