BI Pixie Workload for Microsoft Fabric: Now in Public Preview
BI Pixie Workload is now live in the Microsoft Fabric Workload Hub as a public preview. Every Fabric tenant can add BI Pixie directly from the Workload Hub, with no access request needed, and track how Power BI reports are really used without leaving Fabric.
A month ago we announced the private preview of BI Pixie running natively inside Microsoft Fabric. Today we are taking the next step.
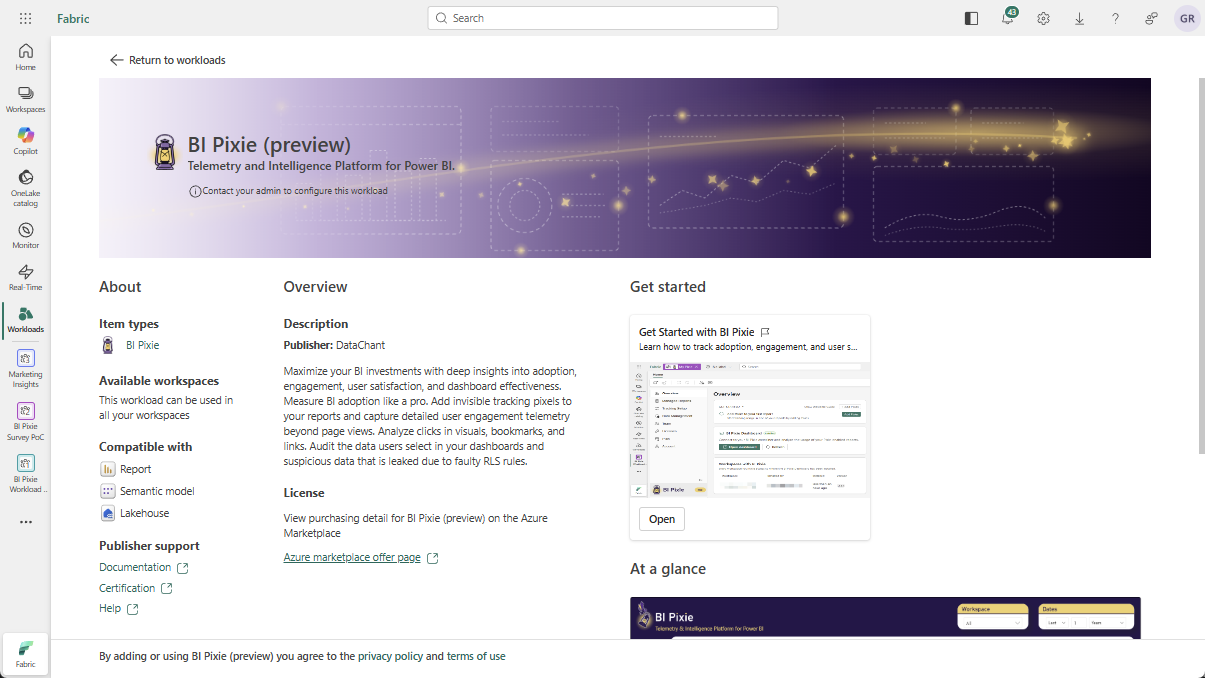
BI Pixie Workload for Microsoft Fabric is now in public preview, live in the Fabric Workload Hub. The waitlist is gone: every Fabric tenant can add BI Pixie directly from the BI Pixie page in the Workload Hub and start tracking how Power BI reports are actually used (page views, visual clicks, filter selections, surveys, and feedback) without leaving Fabric.
A first-class Fabric workload
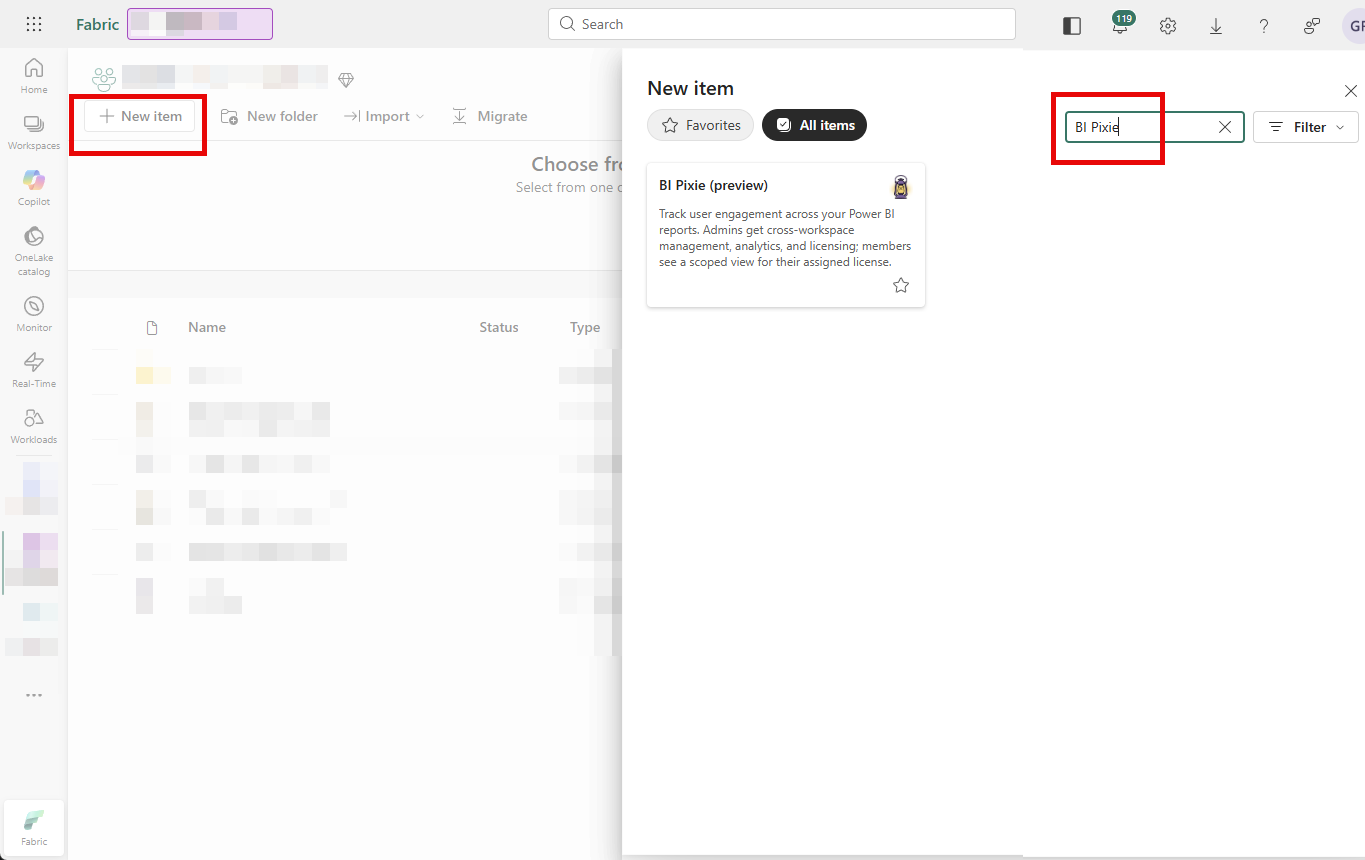
BI Pixie isn’t a separate app you log into. It is a native Fabric item that lives in your workspace, right next to your lakehouses, semantic models, and reports. There is no portal to manage, no infrastructure to deploy, and no separate user directory to maintain. Once a tenant admin adds BI Pixie from the Workload Hub, anyone in the tenant can create a BI Pixie item straight from the workspace + New menu.
Because it runs inside Fabric, BI Pixie inherits the platform you already trust. Access is governed by your Fabric workspace roles, so the people who can edit a report are the people who can track it. Telemetry lands in OneLake in your capacity’s region, keeping your engagement data on the same governed data plane as everything else in Fabric. And the BI Pixie Dashboard is set up automatically in the same workspace, so you are analyzing adoption and engagement within minutes of adding your first Pixies.
What you get
Open a BI Pixie item and the full BI Pixie experience is there, inside Fabric:
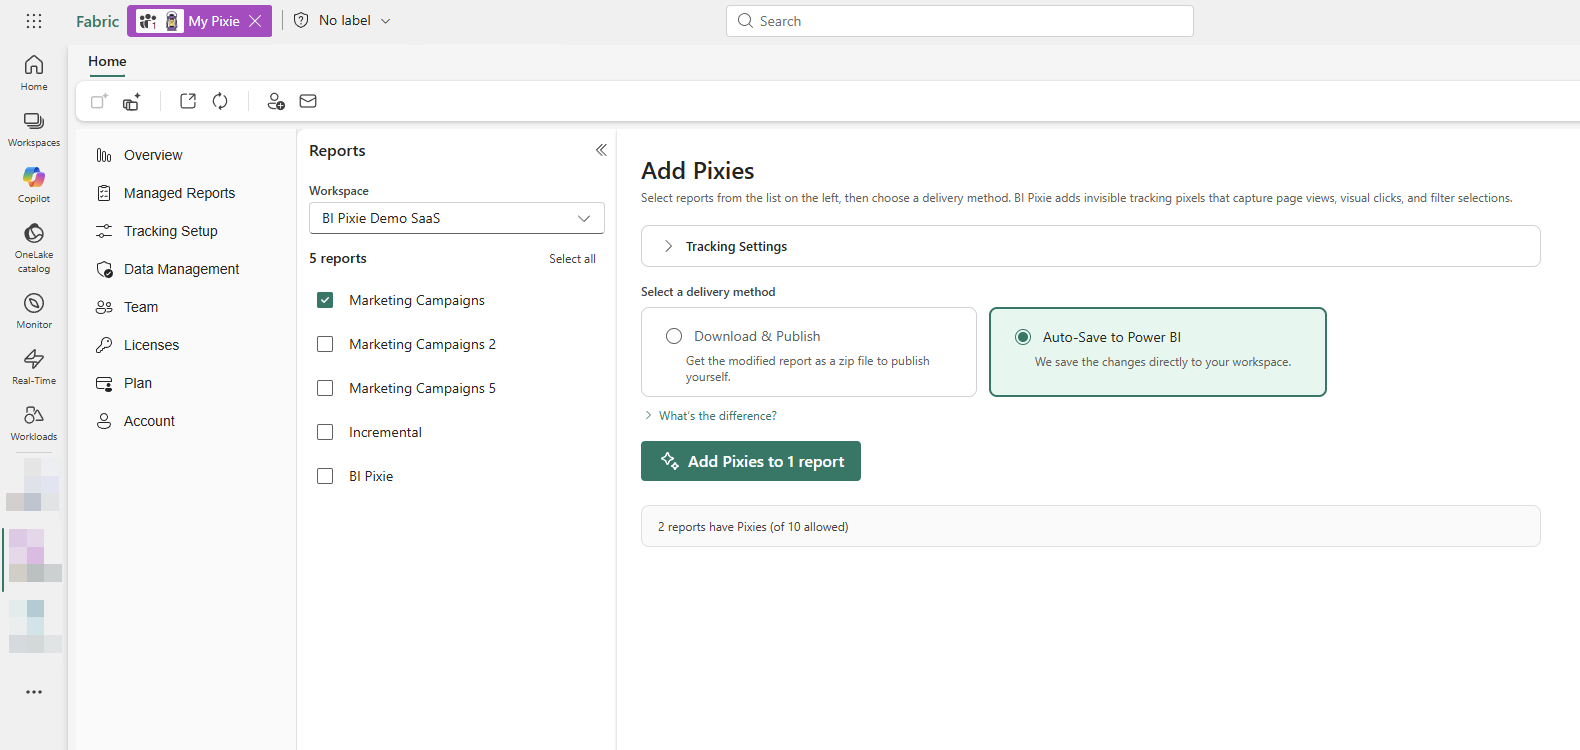
- Managed Reports: add invisible tracking Pixies to the reports in any workspace you can edit, in a couple of clicks. BI Pixie writes the tracking elements directly into the report definitions.
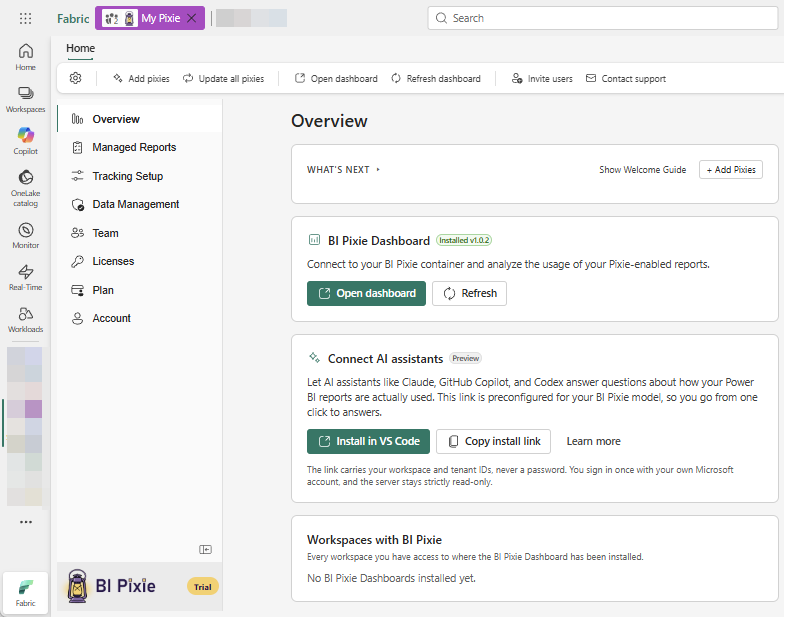
- The BI Pixie Dashboard: set up automatically in the same workspace, with adoption, engagement, satisfaction, and business-outcome insights that match what BI Pixie Cloud customers know.
- Surveys and feedback: embed NPS, business value, and time-saved surveys directly inside your Power BI reports.
- RLS auditing: detect Row-Level Security misconfigurations before they become incidents.
- OneLake-native telemetry: your engagement data lives in OneLake and can be shared with other Fabric items through shortcuts, lineage, and sensitivity labels.
Ask your usage data anything, right inside Fabric
Engagement data is only as valuable as the questions you can ask of it. That is why the BI Pixie MCP Server, also now in public preview, connects AI assistants like Claude, GitHub Copilot, Microsoft Fabric data agents, and Azure AI Foundry directly to your BI Pixie data. Instead of writing DAX or exporting tables, you ask in plain language: which reports are unused and could be retired? what is my stickiness? which pages get the most clicks? The answers come straight from your BI Pixie semantic model, match your BI Pixie Dashboard exactly, and the server is strictly read-only.
The workload brings this right to you. From the Overview of your BI Pixie item, a Connect AI assistants card lets you Install in VS Code or copy an install link that is preconfigured for your BI Pixie model, so you go from a Fabric item to answers in a single click. The link carries only your workspace and tenant IDs, never a password, and the server stays strictly read-only.
Start free
The public preview includes a Free tier: up to 3 tracked reports and 2,000 billed sessions, with access to Pro and Enterprise features for evaluation, and no credit card required. When you are ready to grow, a single BI Pixie subscription (through the Azure Marketplace or the BI Pixie subscription portal) covers every BI Pixie item in your tenant.
Get started in five minutes
- Tenant admins: add BI Pixie from the Workload Hub. The Add BI Pixie to Your Tenant guide walks through the tenant setting, distribution scope, and verification.
- Report owners: create a BI Pixie item, add Pixies to a report, and watch the events flow. The Getting Started guide covers your first five minutes.
Open BI Pixie in the Fabric Workload Hub
Prefer Cloud or self-hosted? BI Pixie meets you wherever your Power BI runs. See the deployment options for every way to run it.