Admin Monitoring Is Here: See Your Whole Power BI Tenant, from Performance to AI Adoption
Admin Monitoring is now available in the BI Pixie Workload for Microsoft Fabric, on the Pro and Enterprise plans. Every day, it brings three new kinds of data into the BI Pixie Dashboard: your tenant’s activity, its inventory, and the queries behind every report. Each one answers questions on its own. The real power appears where they meet the Pixies.
Pixies record what happens inside a report: the pages people open, the visuals they click, the filters they choose and what they think of it. Admin Monitoring records everything around it: how heavy each visual’s queries are, what people export, who built the report, what it is built on, and whether people asked AI instead. With all of it in one dashboard, you can answer questions that neither could answer alone. Is the slow page the one people stop opening? Is the person who waits on a slow query the same person who clicks that visual every morning? Did the people who stopped opening a report start asking Copilot?
Admin Monitoring covers every report in the tenant, with or without Pixies, so the tenant-wide view is there from the first day. Where a report carries Pixies, you see the whole story.
It starts where most questions start: a report that has become slow.
Start with the report people complain about
Every Power BI administrator knows the message. A report that a whole department opens each morning has become slow, the capacity it runs on is busy, and someone wants to know why and what will be done about it. The answer already sits in your tenant, in the queries each report sends to its semantic model. Admin Monitoring reads every one of those queries, not a sample, and measures the CPU time each visual uses.
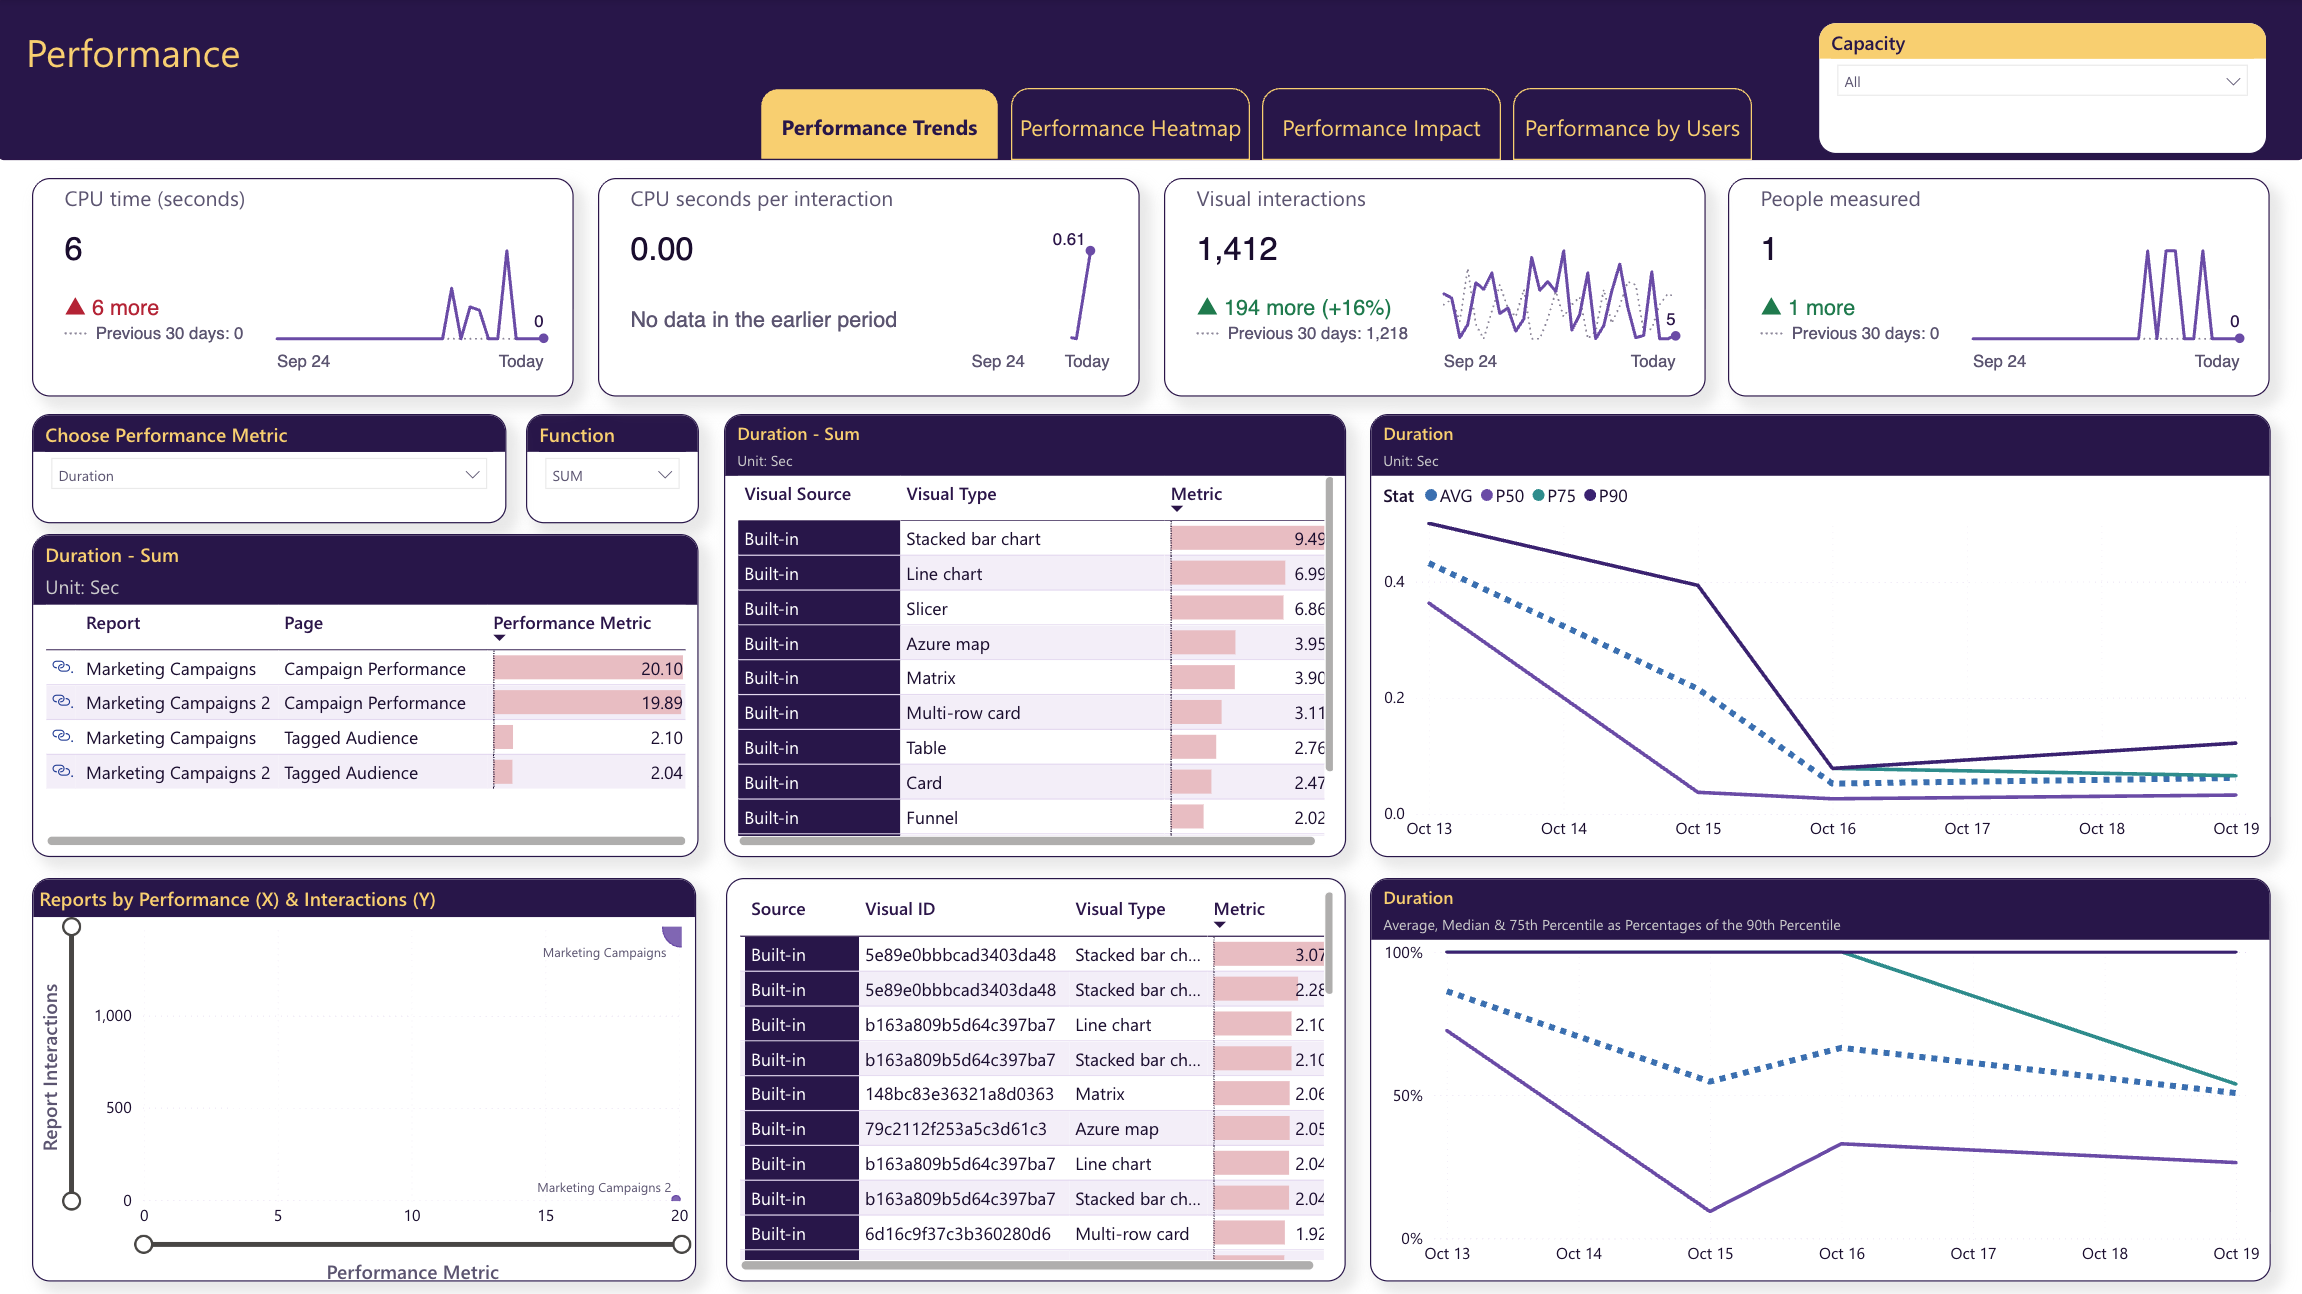
Open Performance Trends first. It follows CPU time by report, page, visual and visual type, and places each report by how heavy it is and how much it is used. A report that is both heavy and widely used stands out, and that is the one to fix first, because improving it helps the most people.
Then open that report in Performance Heatmap. It draws the report page as a map of its visuals, each colored by how heavy its queries are, so the visual that slows the page down stands out in red. It also names the measures and columns behind each visual’s query.
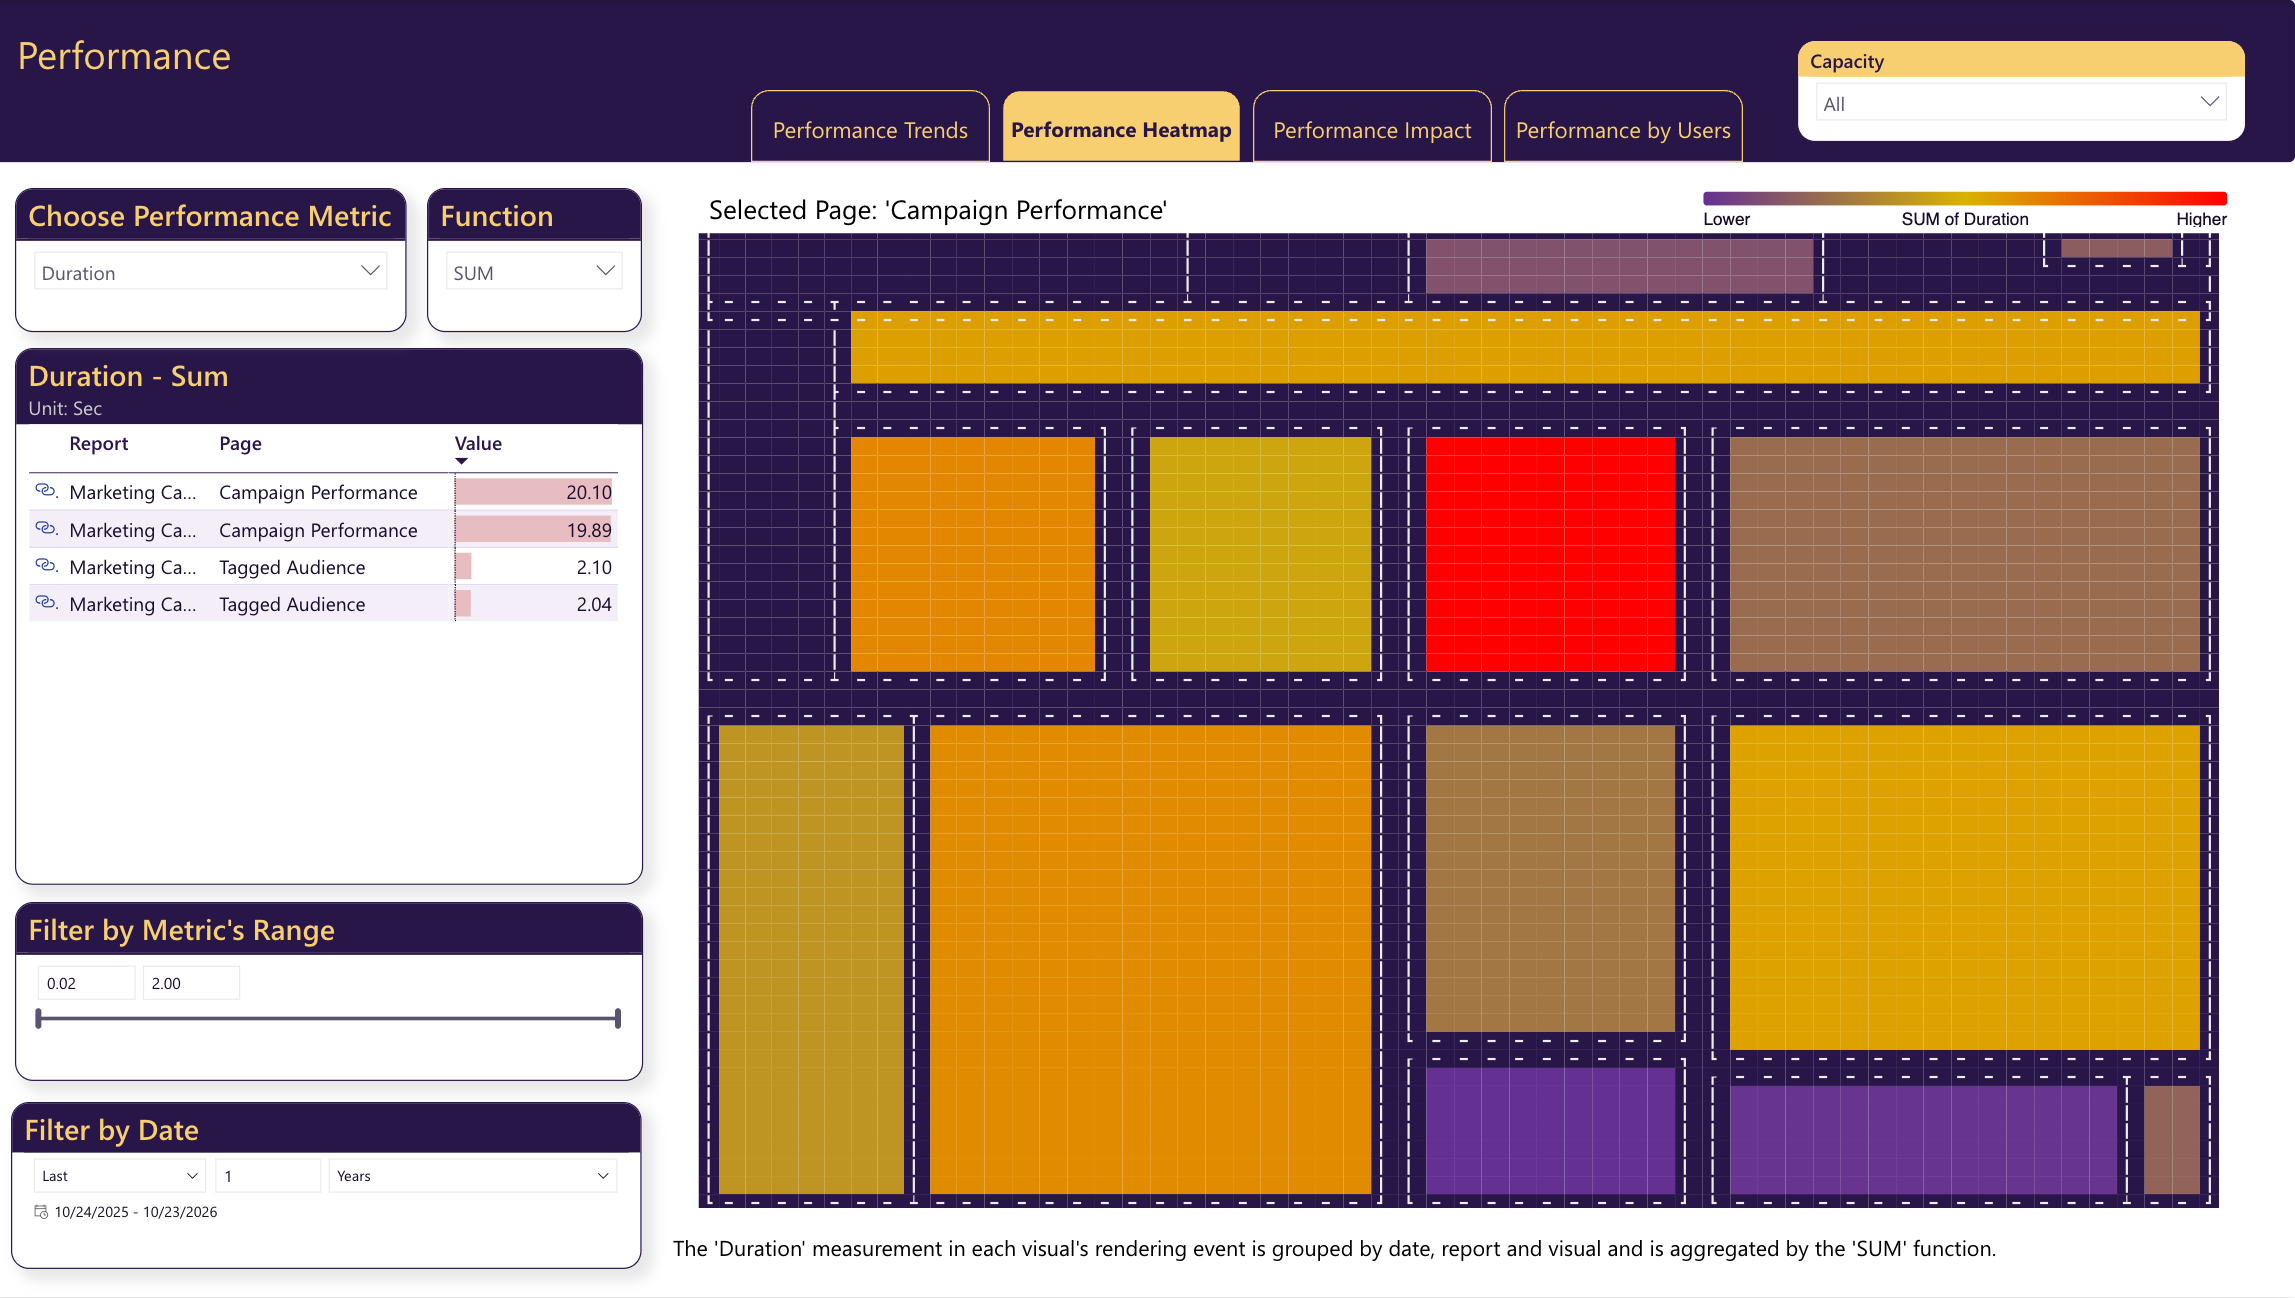
This is often where the real fix appears. When the measure behind that red visual also appears in many other heavy visuals, rewriting it once makes every report that uses it faster. Two more pages help you make the case and plan the change:
- Performance Impact sets each page’s performance against a business measure that Pixies collect, such as interactive sessions, so you see whether slow pages are losing their audience. It lists the heaviest visuals with a sample of the DAX query each one sent.
- Performance by Users shows whom the slow reports reach: the reports, the visuals and the people with the most CPU time. When your usage tracking and Admin Monitoring identify people the same way, BI Pixie matches each person’s query times to their clicks, so you see the slow visual from the point of view of the people who use it most.
After the fix, keep watching the trend. When CPU seconds per interaction rises while interactions hold steady, a report or its semantic model got heavier, and a recent change is the first place to look.
See what leaves your reports, and who takes it
The same queries also record what people took with them. Every export from a report is a query too, so Admin Monitoring measures exports alongside performance.
Export Activities counts the exports, the rows they held and the people who made them, with the DAX query behind each export. Export Heatmap draws a report page with each visual colored by its exports, so the visuals people export from stand out.
Exports of many rows by one person are worth a look, especially from reports with sensitive data. And when one visual is exported again and again, people are telling you they need the data in another form, such as a table built for them or Analyze in Excel.
Find the people whose work the organization runs on
Exports are what people take from your reports. The tenant’s activity also records who built those reports in the first place, so BI Pixie can tell the people who build reports and semantic models apart from the people who use them, across the whole estate.
BI Leaderboard ranks the people who build by how much use their work gets. Each person is credited only with the reports and semantic models they changed themselves. Producers & Consumers compares the people who build with the people who use, across capacities, workspaces and reports.
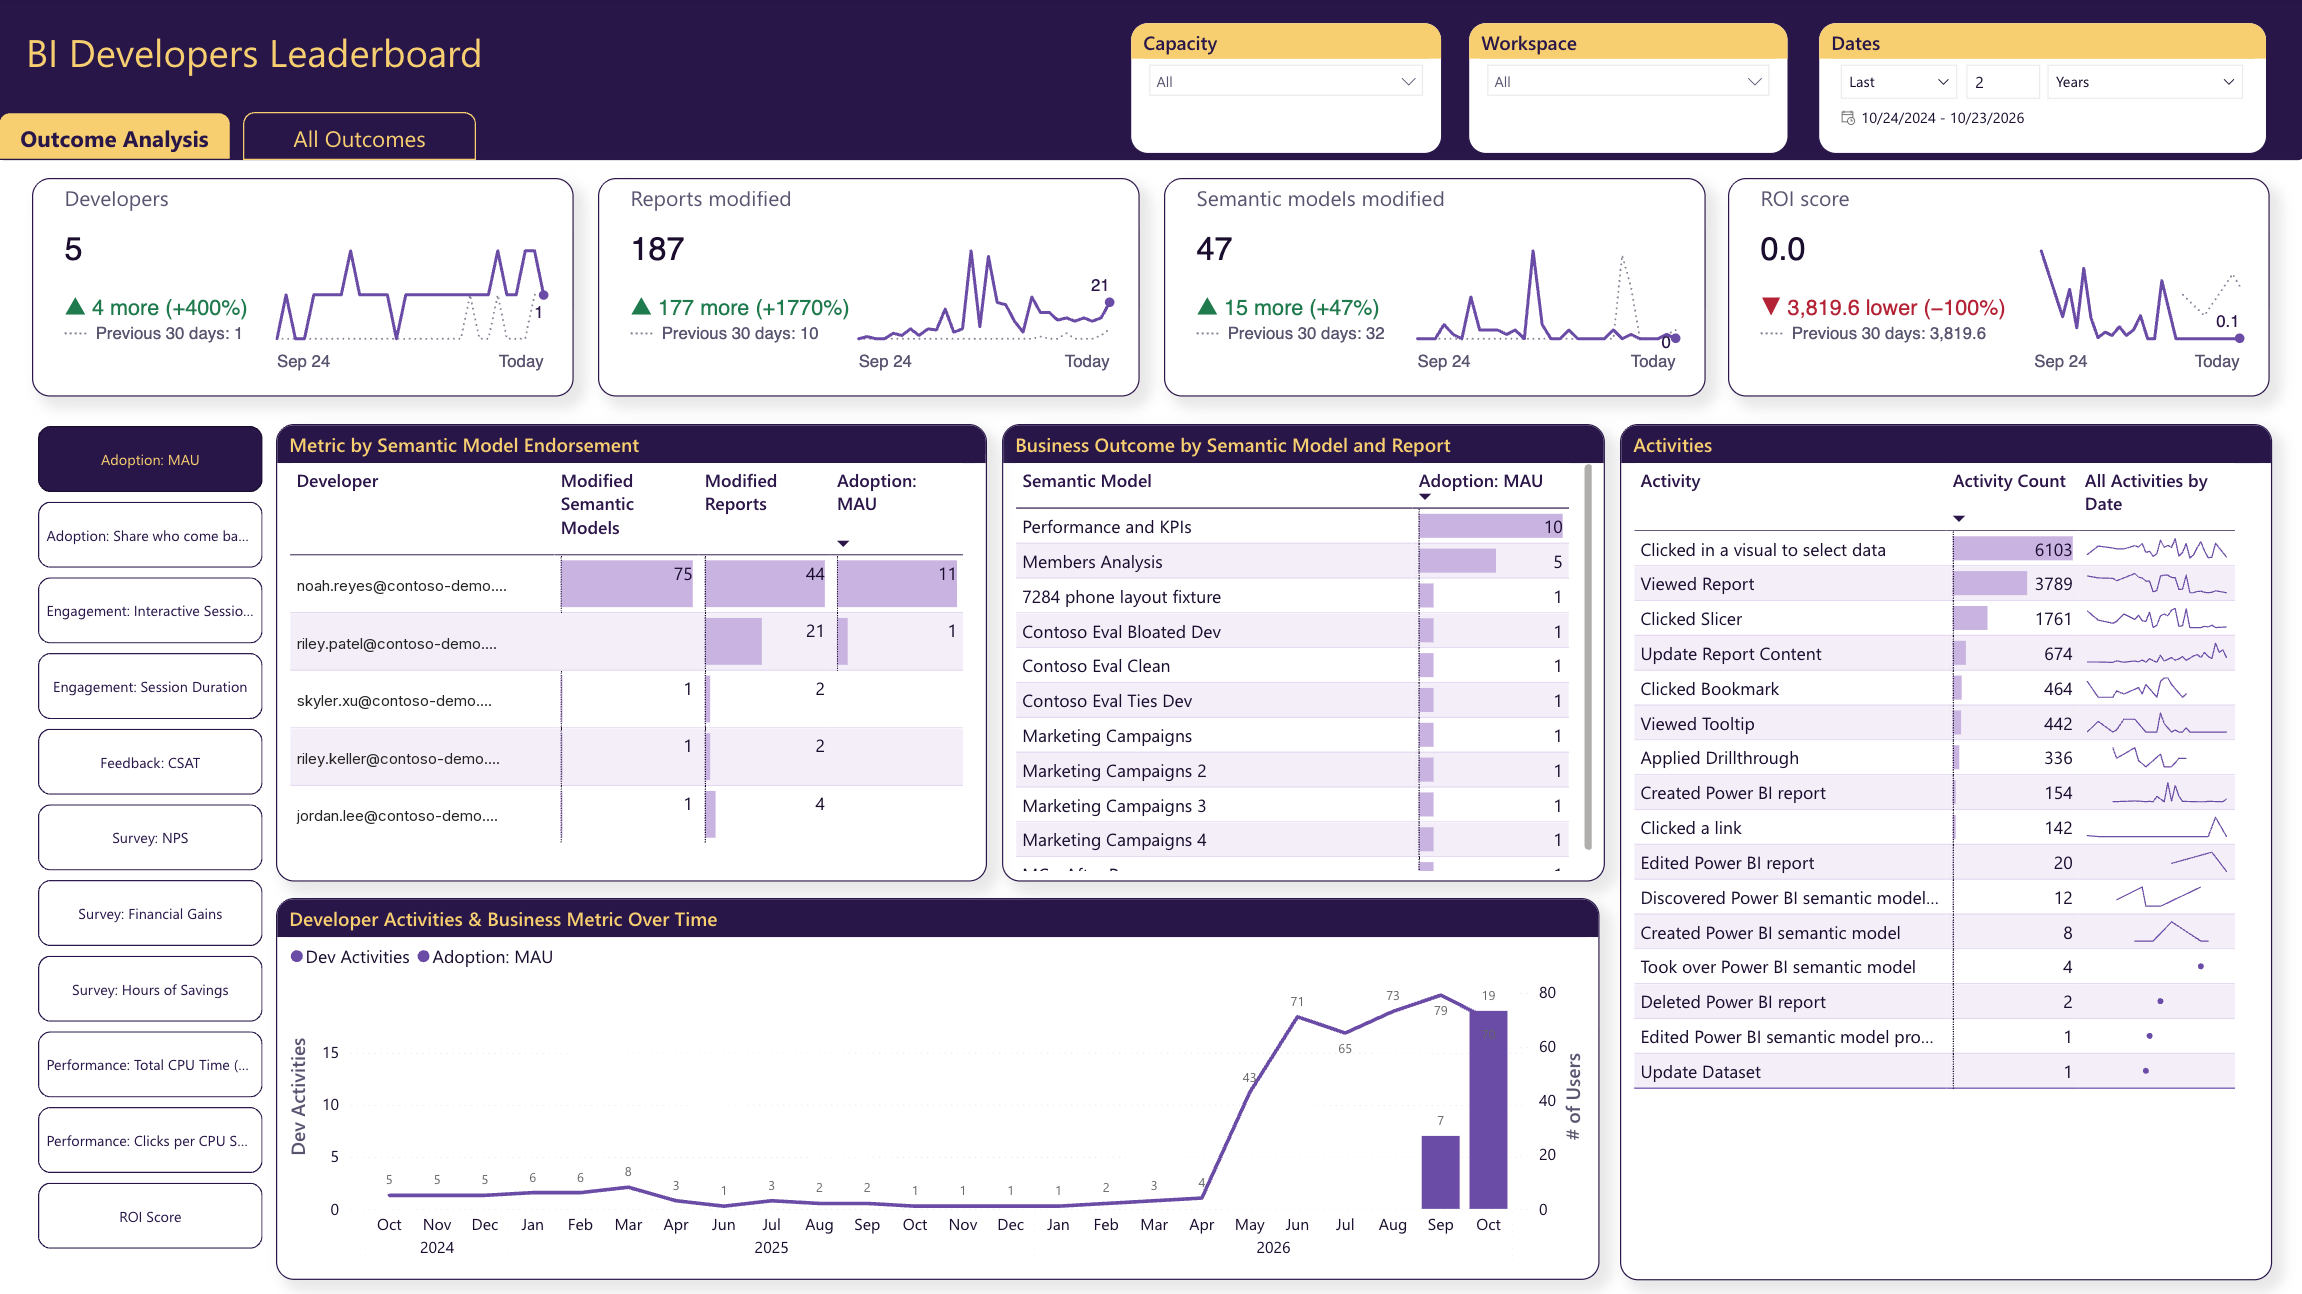
The people whose work gets heavy, repeated use are the ones to ask to mentor others or to own a shared semantic model. A workspace with many producers and few consumers is the place to look for duplicated or abandoned work.
Check what your reports are built on
Behind the work people rely on sit your semantic models and their data sources. BI Pixie scans your tenant to learn what the estate holds, and the Endorsement & Data Sources page puts it in one place. It groups the estate by endorsement, such as certified or promoted, traces each data source to the semantic models and reports built on it, and counts the reports built on each semantic model.
Watch that last count. When it falls, people are building new semantic models instead of reusing the trusted ones you already have.
Are people leaving your reports, or asking AI instead?
There is one more question the tenant’s activity can now answer, and it is becoming the most important one. When people ask Copilot or a Fabric data agent instead of opening a report, report views fall even though people still rely on your data. A falling usage chart no longer tells you whether people left or moved.
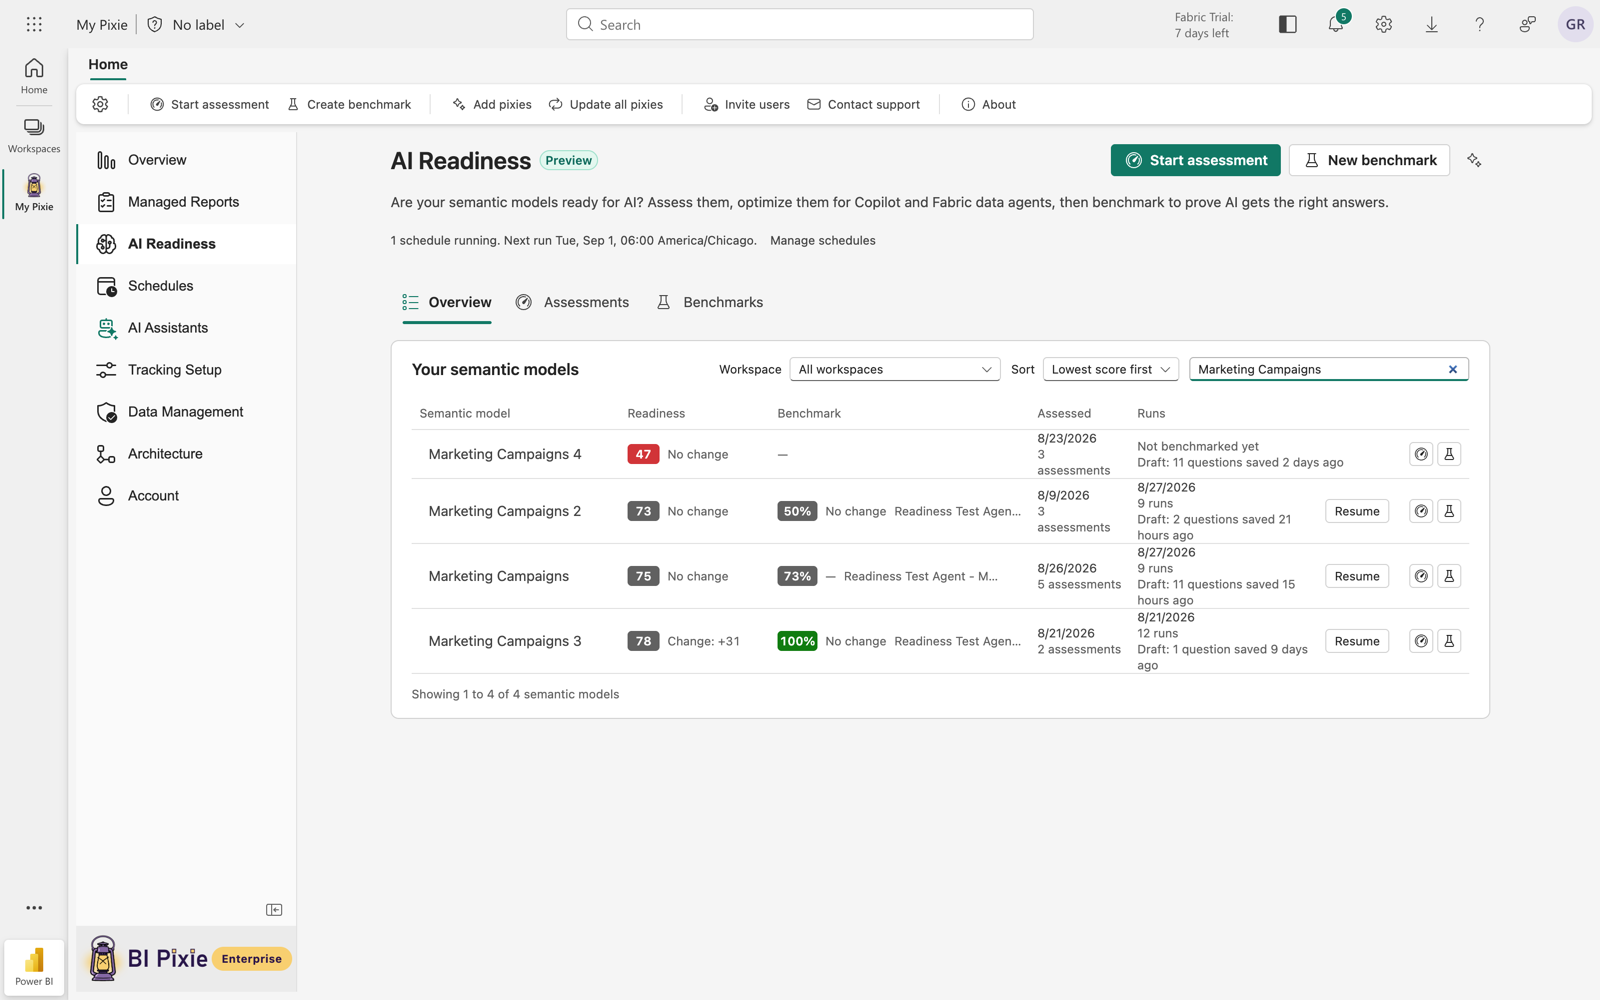
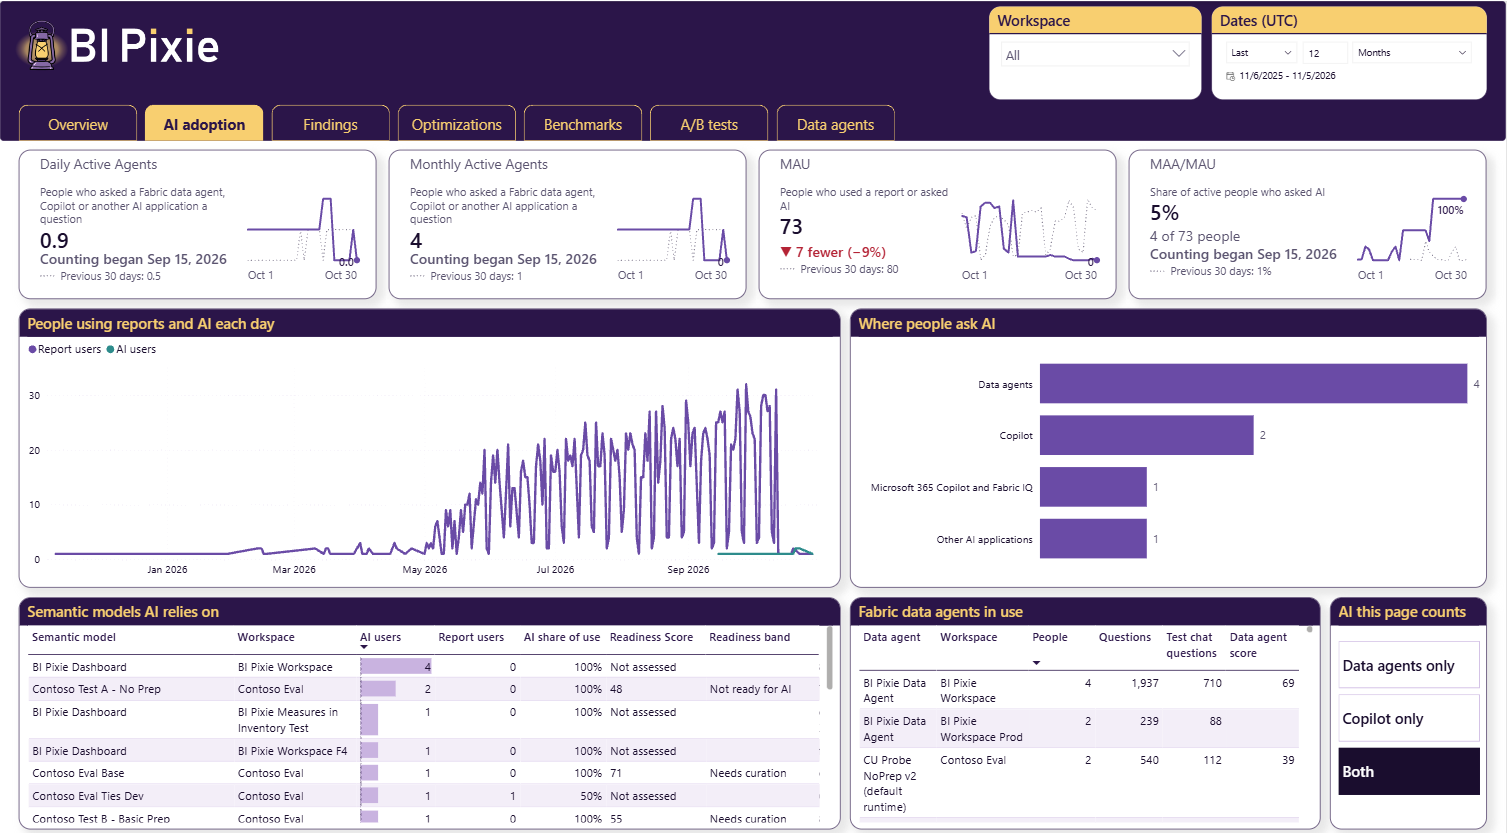
The AI Readiness Dashboard now has an AI adoption tab, right after Overview, built on the activity that Admin Monitoring collects. It counts people, never questions, and a person counts once a day however many questions they ask.
- Monthly Active Agents (MAA) counts the people who asked AI a question in the last 30 days. Daily Active Agents is the average number of people a day who did.
- MAU (monthly active users) counts the people who used a report with Pixies or asked AI a question in the last 30 days.
- MAA/MAU is the share of those active people who asked AI.
This is where the two sources of data meet most clearly: Pixies count the people who use your reports, Admin Monitoring counts the people who ask AI, and the tab puts them on one chart. A slicer chooses whether the tab counts Fabric data agents, Copilot, or both, and both also counts Claude and other AI applications. If MAA/MAU rises while report use falls, your audience is most likely moving to AI rather than leaving. The tab appears once Admin Monitoring is on.
Built on Microsoft’s own APIs, and your data stays in your tenant
Every answer above comes from three kinds of data that Admin Monitoring reads with Microsoft’s own APIs, every day. It reads nothing else from your tenant.
- Activity: who opened, shared, changed and exported content, from the Power BI activity log through Admin - Get Activity Events.
- Inventory: which workspaces, semantic models and reports exist, their data sources, their endorsement and how they connect, from the Power BI scanner APIs.
- Performance, optional: the queries behind your reports, from Fabric workspace monitoring or from an Azure Log Analytics workspace your workspaces already send their logs to.
Admin Monitoring writes everything it collects to a lakehouse in your own Fabric workspace, using notebooks that run on your Fabric capacity. User names are hidden by default: BI Pixie replaces each name with a masked ID before anything is written, and does not keep client IP addresses. To compute those IDs, the notebooks send BI Pixie a one-way hash of each name, never the name itself, and BI Pixie stores neither the hashes nor the IDs. That hash is the only thing that leaves your tenant. When an audit needs real names, you can keep them, and change your mind later in Settings.
If you already use the admin monitoring workspace that Microsoft Fabric gives every administrator, Admin Monitoring works alongside it. It adds what you need to act on performance, down to the visual and the measure, and it connects every answer to what Pixies record inside your reports, in one BI Pixie Dashboard.
Set it up in four steps
You start Admin Monitoring from Admin Monitoring in the sidebar of the BI Pixie item. Setup asks four questions:
- Who should see the data? Everyone with access to the workspace that holds the BI Pixie item can see it. In the same step, you choose whether user names are hidden, which is the default, or kept.
- What should BI Pixie monitor? The whole tenant, or the capacities and workspaces you choose.
- Where is your performance data? Workspace Monitoring, Azure Log Analytics, or none for now. You can add it later.
- Ready to start? Every answer appears on its own card, with the account that runs the daily refresh, so you can change any of them before you start.
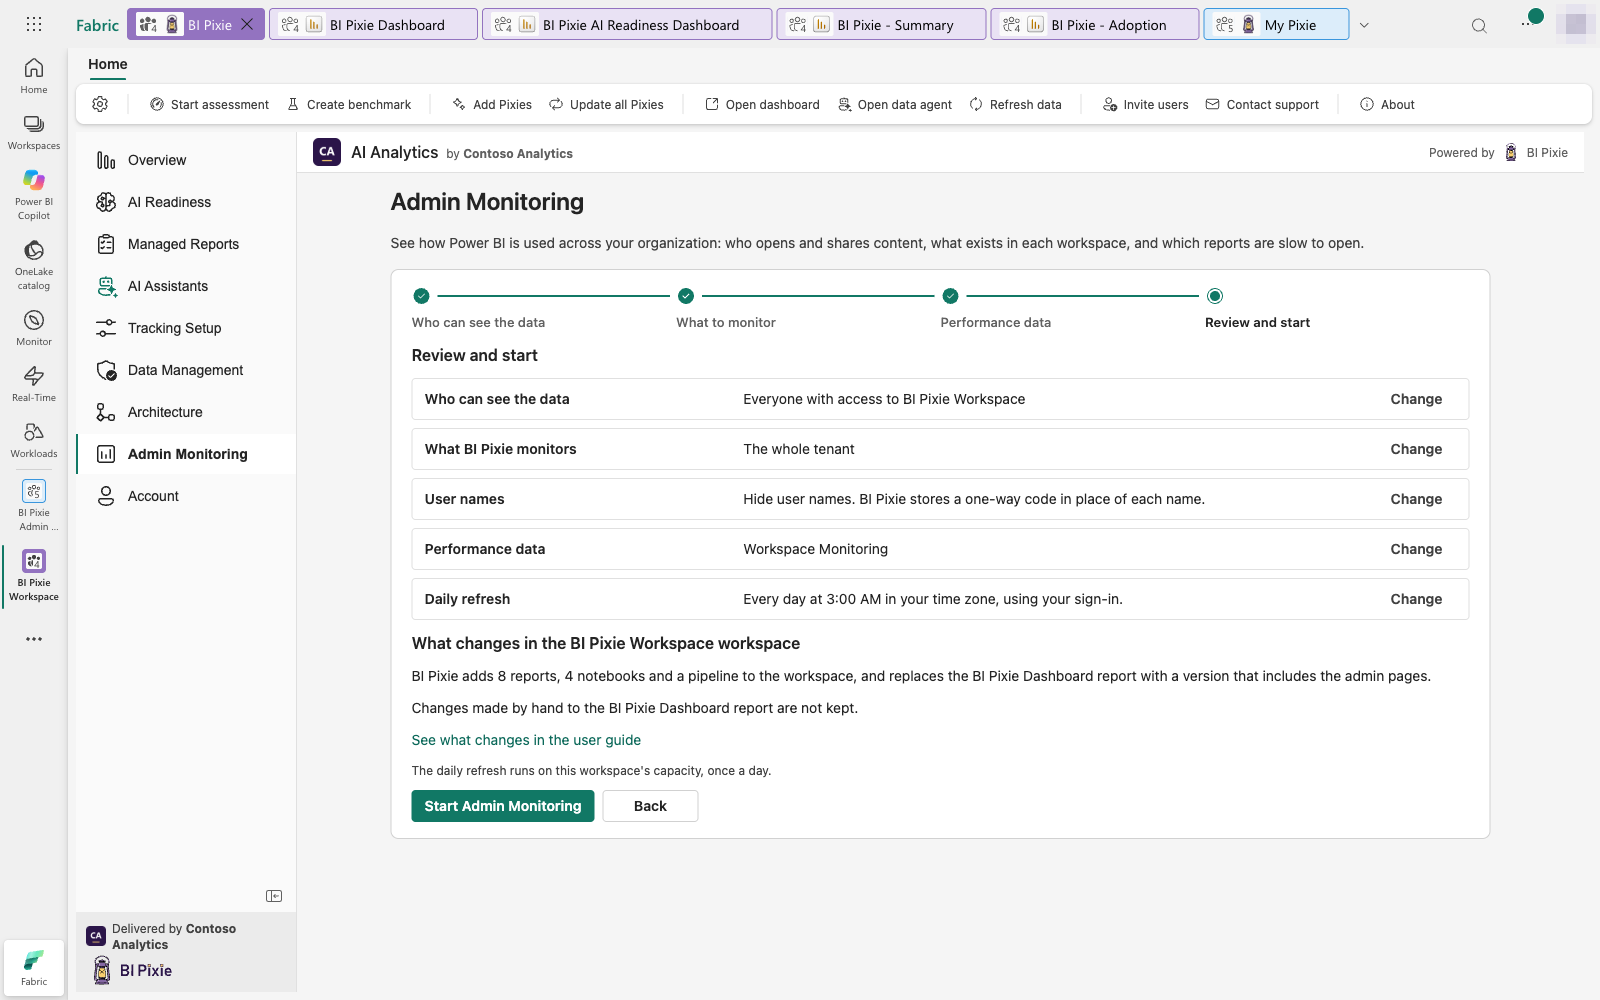
Nothing changes in your workspace until you select Start Admin Monitoring. BI Pixie then adds the admin pages to the BI Pixie Dashboard, along with 8 reports, one for each area, 4 notebooks and a pipeline. It collects the first data at once, and then every day at 3:00 AM in your time zone.
Microsoft lets only Fabric administrators read tenant activity, so the daily refresh runs with a Fabric administrator’s sign-in or as a service principal. A service principal’s secret stays in an Azure Key Vault your organization owns, and BI Pixie never sees or stores it. From then on, the Admin Monitoring home tells you whether activity, inventory and performance are up to date, and says why when one needs attention.
Find your first slow report today
Admin Monitoring is part of the BI Pixie Workload, which a Fabric administrator adds from the Microsoft Fabric Workload Hub. It is included with the Pro and Enterprise plans, shown on the pricing page, and any administrator of a BI Pixie account on those plans can set it up on a workspace on a Fabric capacity.
Once the first data arrives, open Performance Trends and start with the report that is both heavy and widely used. If it carries Pixies, open Performance Impact next, to see whether its slow pages are already losing their audience. The Admin Monitoring guide walks you through setup, the service principal option, and every page, from performance and exports to AI adoption.