
How to Measure What a Fabric Data Agent Costs Per Question
Learn how to measure what one question costs your Fabric data agent in CU seconds, and gain a realistic estimate of what it will consume in production.
You built a Fabric data agent and you need to take it to production, so first you test it to ensure you have optimized it to provide accurate results. You have an F4 capacity set aside for exactly that. Three rounds of improvements later, you are happy with the results. You think that you are ready for the final round of tests before you deploy the data agent in production. But something you should have been expecting happens. When you ask the data agent a question in that last round, the capacity reaches its limits. You are being throttled for the day.
Before you take a data agent to production, you should know what it costs in CU seconds. Are your data agent and its data sources ready for the demand of real users and downstream AI agents? Will your production capacity hold?
In this article you learn how to measure what your Fabric data agent consumes to answer a single question on your own capacity, and how to use that number to prepare for production.
What a data agent is billed for, and why it varies
Before you measure anything, it helps to know how Fabric calculates a data agent’s cost, and which factors make one question cost more than another.
A data agent is billed for the tokens it processes, at rates Microsoft documents precisely:
| Metric | Per 1,000 tokens |
|---|---|
| Input prompt | 100 CU seconds |
| Cached input prompt | 10 CU seconds |
| Output completion | 400 CU seconds |
For example, 2,000 input tokens and 500 output tokens cost 400 CU seconds.
Microsoft’s published rates are fixed. The number of tokens those rates are applied to changes from one question to the next, and three factors move it.
The context that travels with every question. An input token is billed at a quarter of the rate charged for an output token, which makes input look like the cheaper half of a data agent’s bill. A data agent processes far more input than output. Your question is a few dozen tokens, and the context sent along with it can run to tens or hundreds of thousands.
Microsoft names the pieces of context sent with every question: “Additional context such as Data Agent Instructions, Data Source Instructions, Example Queries, and conversation history also contribute to token usage and consumption.” A data agent grounded on a Power BI semantic model carries more context than the four pieces Microsoft names. The semantic model best practices page states that the DAX generation tool builds its query from “schema, metadata (synonyms, min and max values of numerical columns, report visual metadata, and more), context configured in Prep data for AI, and the conversation history.”
How hard the question is. A simple lookup and a multi-step ranking question can differ by orders of magnitude on the same data agent over the same grounded tables, so the cost of a question is a range rather than a single figure. Where a question lands inside that range depends on how much work the data agent does to resolve the wording onto objects in the semantic model, which makes the cost of a question a property of what people type rather than of what you built.
Which runtime the data agent is on. A new data agent gets the standard runtime by default, and the gap between an easy question and a hard one is at its widest there. Microsoft also offers a preview runtime, on which that gap narrows sharply (more about it here). The runtime your data agent is on changes the numbers you measure, and it does not change the way you measure them.
What a question costs comes down to context size, question difficulty and runtime, and none of the three shows in the answer the data agent returns. Measuring a data agent’s cost on your own capacity is what turns those three factors into a number you can plan with.
Where Fabric reports what your capacity consumed
Fabric meters every operation that runs on a capacity, and it publishes those figures in one place: the Microsoft Fabric Capacity Metrics app, which Microsoft provides for capacity administrators. Installing the app puts a Power BI report and its semantic model into your tenant, and that semantic model carries a row for every billed operation on every capacity you administer, including each question a data agent answers.
Fabric’s management APIs report the size a capacity is provisioned at rather than what it consumed, so a paused capacity and a busy one on the same SKU report the same figure. What an individual item consumed reaches you through the Capacity Metrics app.
Every query in this article is read-only DAX against that semantic model, run through the Execute Queries REST API, rather than a figure read off the app’s report pages. A cost per question needs a table you can filter, sort and compute with.
A note on what Microsoft supports. Microsoft states that the Capacity Metrics semantic model “is only supported for use by the reports provided in the application”, and that “any consumption from, usage of, or modification of the semantic model isn’t supported”. Every query in this article reads that semantic model and writes nothing to it, and reading it this way still sits outside the supported use Microsoft describes.
What you need to measure a data agent’s cost
Measuring what one question costs requires three things:
- The Microsoft Fabric Capacity Metrics app installed in your tenant.
- Capacity admin rights on the capacity you want to read.
- The tenant setting Semantic model Execute Queries REST API enabled.
Measuring a data agent’s cost works the same whether that data agent is grounded on a lakehouse, a warehouse, a KQL database, or a Power BI semantic model. Every query runs on a Power BI Pro license, so you need no notebook, no XMLA endpoint, and no Premium capacity.
The DAX that isolates one data agent question
Every query in this article is one POST to the Power BI Execute Queries endpoint, with the DAX in the request body:
POST https://api.powerbi.com/v1.0/myorg/datasets/{datasetId}/executeQueries{datasetId} is the Capacity Metrics semantic model, which sits in the Microsoft Fabric
Capacity Metrics workspace under the name Fabric Capacity Metrics. Resolve it by name
rather than pasting a GUID, because the id changes every time the app is reinstalled. The
endpoint accepts one query per request and answers with rows of JSON.
You have a choice about what to ask the data agent before any of this. Asking one question at a time, with idle minutes between, gives you the cost of each question. Asking a batch and dividing the total by the number of questions gives you an average across that batch. Which one you want depends on what you are doing: drilling into what a single question costs, or extrapolating from your test to what a production audience will draw. The questions you ask together are a run, and the queries below separate one run from another.
Start with the query that returns one row per billed operation, each row carrying its own start time. Start time is the only column that separates two runs of the same data agent on the same day:
DEFINE
MPARAMETER 'CapacitiesList' = { "<your-capacity-guid>" }
EVALUATE
FILTER(
    SUMMARIZECOLUMNS(
        'Item History Main'[ArtifactName],
        'Item History Main'[OperationName],
        'Item History Operation Detail'[OperationStartTime],
        "CU_s", SUM('Item History Operation Detail'[CU (s)]),
        "Ops", SUM('Item History Operation Detail'[Operations]),
        "Dur_s", SUM('Item History Operation Detail'[Duration (s)])
    ),
    [CU_s] > 0
        && 'Item History Main'[OperationName] = "AI Query"
        && 'Item History Operation Detail'[OperationStartTime] >= DATE(2026,8,14)
)
ORDER BY 'Item History Operation Detail'[OperationStartTime] ASC
Rows come back one per billed operation, like this. The figures here and in the examples below are illustrative, so put your own in their place:
ArtifactName      OperationName  OperationStartTime     CU_s  Ops  Dur_s
----------------  -------------  -------------------  ------  ---  -----
Sales Data Agent  AI Query       2026-08-29T22:42:00   260.4    1     60
Sales Data Agent  AI Query       2026-08-29T22:45:00  16002.7   1     60
Sales Data Agent  AI Query       2026-08-29T22:48:00   258.1    1     60
OperationStartTime always carries zero seconds, because Capacity Metrics reports in one-minute
windows rather than at the instant a question ran. Dur_s is the length of those windows for the
row, so it counts sixty seconds per operation rather than the time your question took to answer.
What comes back, and what happens when you run the query again. Each row is a single billed operation with its own start time and its own CU cost. Nothing in this table accumulates, so there is no running total and nothing to subtract. Ask another batch of questions, run the query again, and the rows you saw last time come back unchanged with the new rows underneath. Rows leave the table only when an operation ages out of the Capacity Metrics retention window.
Per-operation detail is a property of Item History Operation Detail specifically. Read that
table whenever the cost of a single question matters.
Two syntax details stand between your first paste and a result. The MPARAMETER assignment
must sit inside a DEFINE block, because a bare MPARAMETER line is rejected with a syntax
error. A capacity outside your home region needs one more parameter: add
MPARAMETER 'RegionName' = "<your capacity's region>" in the same block, using the region the
Capacity Metrics app shows for that capacity, or the query comes back empty.
When to query, and how to keep other activity out of your numbers
A reading means something only when two things are true: you ran the query at the right time, and you know what else was running on the capacity while you asked your questions. Both are easier to arrange in advance than to spot afterwards.
Wait fifteen minutes after the last question finishes. Microsoft documents that usage data becomes available within 10 to 15 minutes. Wait the full fifteen minutes even if the data lands sooner, because an early read raises no error. What comes back instead is a table that looks complete with one or two questions missing from it, and nothing in the output tells you which questions are missing. Measure that wait from the moment a question finished rather than from the moment you asked it, because a data agent is not billed until it completes, and a question can take a long time to answer.
Other data agents on the same capacity do not spoil your reading. The Capacity Metrics app
attributes every operation to the item that drove it, so a dozen data agents running side by side
stay separable. The per-question query above filters on the AI Query operation and returns the
data agent’s name on every row, so read your own data agent’s rows out of the result, or add its
name to the filter and let the query do it.
Two situations leave a reading contaminated:
- Other people asking your data agent. Attribution is per item rather than per user, so a colleague’s question lands in the same one-minute window as yours and is indistinguishable from it. Measure on a data agent nobody else is querying, or use the Fabric Chargeback app, which does record which user drove the consumption.
- Two of your own runs inside one minute. Two runs that overlap inside the same one-minute window cannot be told apart. Leave a few idle minutes between runs, which is all the separation you need.
A data agent appears as two items that share one name. The questions bill under the
DataAgent item kind, on the AI Query operation. Beside it sits an LlmPlugin item carrying
the same display name, holding the agent’s OneLake reads and writes. The two have different item
ids, so they are two items rather than one item counted twice.
The Experience column in Item History Main separates them. Fabric tags every operation with
the engine that ran it: AS for semantic model queries, DMS for warehouse queries, SparkCore
for notebook compute, lake for OneLake storage traffic, and ML for the AI workloads. Group by
that column and the two rows separate:
Experience  ArtifactKind  OperationName            CU_s
----------  ------------  -----------------------  -------
ML          DataAgent     AI Query                 26041.6
lake        LlmPlugin     OneLake Read via Proxy      31.4
lake        LlmPlugin     OneLake Write via Proxy      9.8
The ML row is what a question cost. The lake rows are the agent reading and writing files in
OneLake, which is the same experience a lakehouse reports its own file traffic under, and they
are not part of answering anything. Measure the ML row.
Microsoft’s Fabric operations
page lists AI query under the LlmPlugin item. The Capacity Metrics app we queried reports
AI Query under the DataAgent kind instead. Filtering on the operation name rather than on the
item kind returns the cost of the questions under either arrangement, which is why every query in
this article filters on AI Query.
Confirm that the capacity was not throttled while you were measuring. A throttled capacity delays or rejects operations, which changes what you are measuring rather than what your questions cost. This query returns the capacity’s state transitions, most recent first, so you can check that no transition falls inside the window you measured:
DEFINE
MPARAMETER 'CapacitiesList' = { "<your-capacity-guid>" }
EVALUATE
SELECTCOLUMNS('System Events',
    "State", 'System Events'[Capacity state],
    "Reason", 'System Events'[Capacity state change reason],
    "Time", 'System Events'[Capacity state transition time])
ORDER BY [Time] DESC
No rows is the answer you want, because it means the capacity held one state throughout. A capacity that went into overload while you were measuring returns the transition instead:
State       Reason                    Time
----------  ------------------------  -------------------
Active      Recovered                 2026-08-30T00:58:00
Overloaded  Background job rejection  2026-08-29T22:51:00
Read your capacity without writing DAX
We packaged the queries in this article as open source skills for coding assistants, so in VS Code with Claude Code, GitHub Copilot, Cursor, or Codex you can ask in your own words, and the assistant writes and runs the query for you:
/plugin marketplace add DataChant/BI-Pixie-SkillsThe BI Pixie Skills repository holds the skills, a guide to the Capacity Metrics semantic model, and ready-to-run DAX. There is more on reading Fabric capacity metrics this way in Agentic and Programmatic Fabric Capacity Monitoring Using a Pro License.
Three questions worth asking once the skills are installed:
- “How much CU did my data agents consume yesterday, by data agent?”
- “Show me every AI Query operation on this capacity since Friday, with its start time.”
- “What percentage of my F16’s daily budget did that data agent use?”
How to use CU seconds in your cost estimates
The queries above return CU seconds per billed operation. Three numbers derived from those CU seconds are what you plan a production capacity with.
1. Cost per question
The first query hands you this one row at a time. Each row covers a single one-minute window, and
the Ops column says how many billed operations landed in that window. Leave idle minutes
between your questions and every row comes back with Ops at 1, which makes that row’s CU_s
the cost of that one question.
A row with Ops above 1 holds more than one question added together. Divide its CU_s by Ops
for a usable figure, or leave wider gaps and measure again.
Ten questions asked with gaps return ten costs rather than one, so the aggregation is yours to choose. Sum the rows for the run total. Divide that total by the number of questions for an average you can extrapolate from. Take the most expensive row when you are sizing a capacity, because a workload has to survive its hardest question rather than its average one. Asking the same question three times returns three rows, and the spread between those three is noise rather than a difference between questions.
Group your questions by kind before you compare anything. Microsoft’s worked example prices a request at 400 CU seconds on a stated token count, and your own questions carry a different amount of context, so the comparison worth making is between your simple questions and your hard ones rather than between the averages of two runs.
2. Percentage of a capacity’s day
A day’s total is the right number to plan with, because of a mechanism Fabric calls smoothing. Rather than charging an operation at the moment it runs, Fabric spreads its consumption forward, and it spreads a background operation across a 24-hour period. A data agent’s questions are billed as background operations, so a day is the window their cost lands in.
The number in an F SKU’s name is how many CU seconds that capacity delivers every second, so one day’s budget is that number multiplied by 86,400:
| Capacity | CU seconds per day |
|---|---|
| F2 | 172,800 |
| F4 | 345,600 |
| F16 | 1,382,400 |
| F64 | 5,529,600 |
| F128 | 11,059,200 |
A share of a day means little on its own, because nothing in that figure shows what else the capacity was carrying. This query returns CU by workspace and item for each day from a date you choose, so your data agents appear beside everything else that ran:
DEFINE
MPARAMETER 'CapacitiesList' = { "<your-capacity-guid>" }
EVALUATE
FILTER(
    SUMMARIZECOLUMNS(
        'Item History Main'[WorkspaceName],
        'Item History Main'[ArtifactName],
        'Item History Main'[ArtifactKind],
        'Item History Main'[OperationName],
        'Item History Operation'[Day],
        "CU_s", SUM('Item History Operation'[CU (s)]),
        "Operations", SUM('Item History Operation'[Operations])
    ),
    [CU_s] > 0 && 'Item History Operation'[Day] >= DATE(2026,8,18)
)
ORDER BY [CU_s] DESC
Every item that ran that day comes back, ranked by cost, with your data agent among them:
WorkspaceName  ArtifactName        ArtifactKind  OperationName           Day           CU_s  Operations
-------------  ------------------  ------------  ----------------------  ----------  ------  ----------
Analytics      Sales Data Agent    DataAgent     AI Query                2026-08-29  26041.6         100
Analytics      Nightly Load        Notebook      Notebook Scheduled Run  2026-08-29   8210.3           4
Analytics      Sales               SemanticModel Query                   2026-08-29   4187.9        1830
Analytics      Sales Data Agent    LlmPlugin     OneLake Read via Proxy  2026-08-29     41.2         318
The last row is the same data agent under its other item kind, which is why the total for an item and the cost of its questions are not the same number.
The Item History Operation table it reads aggregates per item and per day, so two runs of the
same data agent on the same day arrive already summed. That grain is the right one for a day’s
totals and the wrong one for a single question.
A single run of hard questions can pass 100% of a small capacity’s whole day, so compare a run’s cost against your own capacity’s daily budget before you run a pilot rather than after one.
3. Whether your capacity can carry the data agent
Cost per question and percentage of a capacity’s day both describe consumption that already happened. A projection of what a data agent will draw in production is the number that tells you whether to go ahead, and you can work that projection out before anybody in production has asked anything.
An estimate needs two figures from you: the share of a capacity’s day your data agent may use, and the number of questions you expect it to answer in a day. Both depend on your own situation, so choose them deliberately.
The example that follows uses 5% and 100 questions. Allowing the data agent 5% of a day leaves the other 95% for the reports and refreshes already running on that capacity, and 100 questions a day is twenty people asking five questions each on a working day. Five percent of one day comes to:
| Capacity | Calculation | 5% of one day, in CU seconds |
|---|---|---|
| F2 | 2 x 86,400 x 5% | 8,640 |
| F4 | 4 x 86,400 x 5% | 17,280 |
| F16 | 16 x 86,400 x 5% | 69,120 |
| F64 | 64 x 86,400 x 5% | 276,480 |
| F128 | 128 x 86,400 x 5% | 552,960 |
The last column is the data agent’s daily budget. What the 100 questions draw against it is one multiplication. Only the kind of question changes between the two cases below, and the per-question figures are round numbers chosen to show the arithmetic.
A workload that fits. Suppose the 100 questions those twenty people ask are simple lookups, and you measured 260 CU seconds for one of them.
questions per day  x  CU seconds per question  =  CU seconds per day
100                x  260                      =  26,000
An F16 allows 69,120 CU seconds under a 5% ceiling, so 26,000 CU seconds sits well inside that ceiling, at 1.9% of the capacity’s whole day.
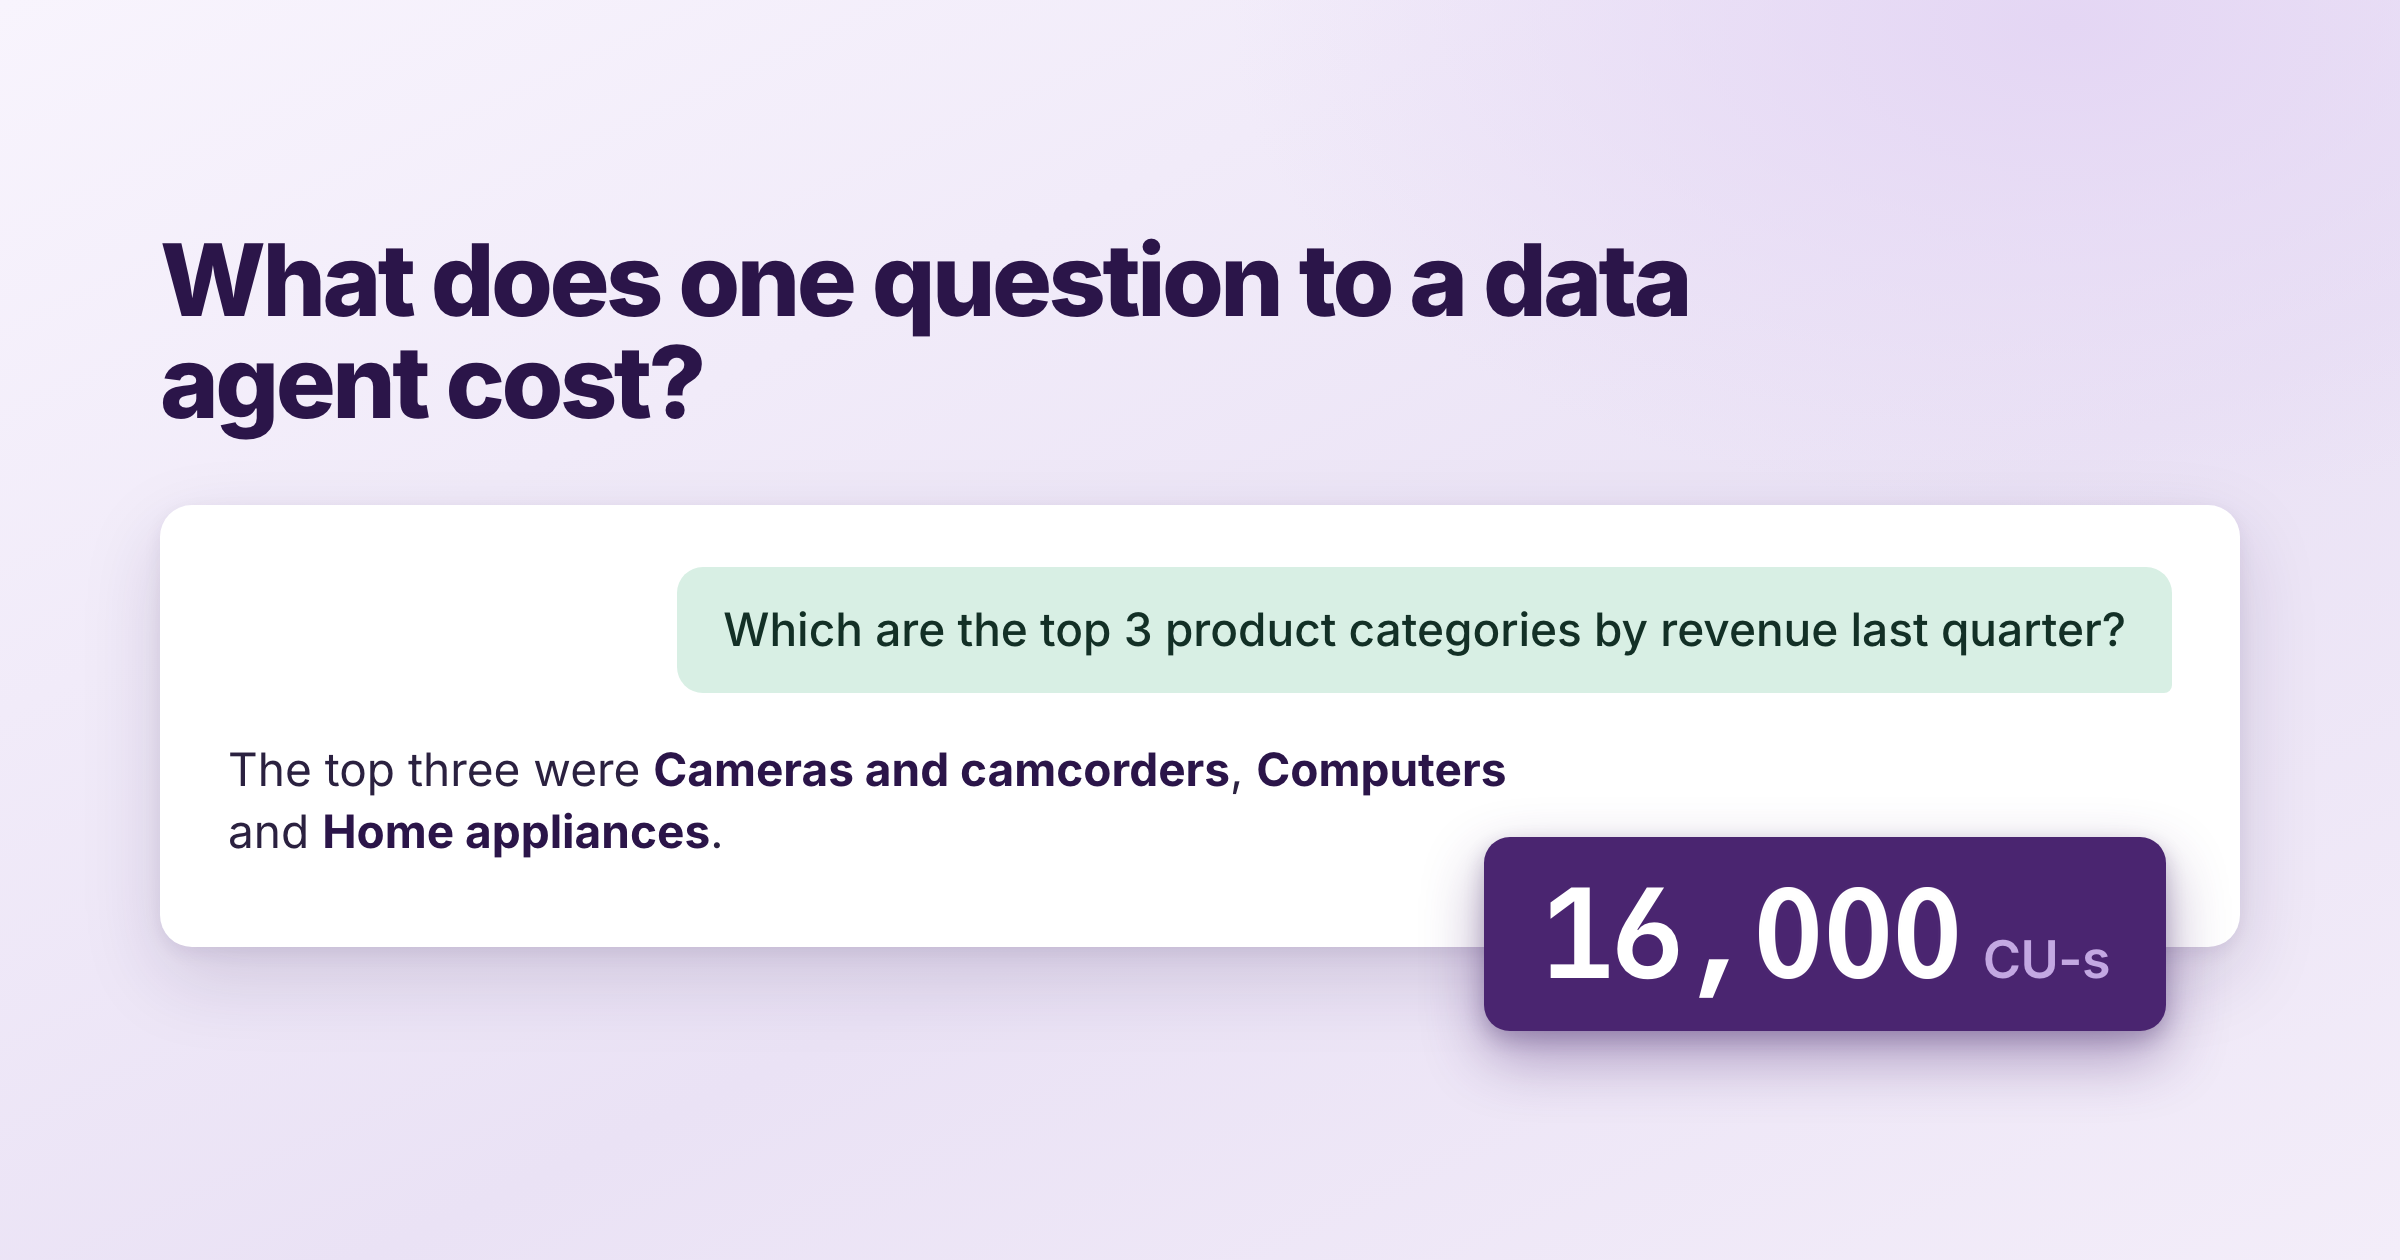
A workload that will throttle. Suppose the same 100 questions are multi-step ranking questions instead, and you measured 16,000 CU seconds for one of them.
questions per day  x  CU seconds per question  =  CU seconds per day
100                x  16,000                   =  1,600,000
An F16’s entire day is 1,382,400 CU seconds. One hundred ranking questions at that cost would consume 116% of the whole capacity before a single report refreshes, which puts the workload past the capacity’s entire day rather than only past the 5% ceiling you set for the pilot. Fitting that same workload inside 5% of a day would require roughly an F512.
The two workloads differ by more than sixty times in cost, and not at all in the number of people asking. The data agent is the same in both cases, the semantic model is the same in both cases, and the only difference between them is the kind of question people typed.
The same arithmetic sizes a benchmark. On a test capacity the question usually runs the other way round. You are not asking what a set of questions will cost. You are asking how many questions fit before the capacity runs out of day, so divide the budget by the cost of one question:
CU seconds available  /  CU seconds per question  =  questions you can ask
345,600               /  16,000                   =  21.6
An F4’s whole day is 345,600 CU seconds. At 16,000 CU seconds for a ranking question that is about 21 questions before the day is spent, so a benchmark of fifty hard questions asks for more than a small test capacity holds. At 260 CU seconds for a simple lookup the same F4 carries more than a thousand. Size the benchmark before you run it, and split it across days when the question count you want costs more than a day.
The gap between a simple lookup and a multi-step ranking question is much narrower on the preview runtime, where cost per question barely moves with question difficulty. You can then size a capacity against a typical question rather than against your hardest one.
Moving the same data agent to a larger SKU gives you headroom to prevent throttling, but it will not make the data agent more efficient per answer. Cost per question stays the same.
Three pitfalls when you measure a cost per question
A measurement here can go wrong without anything failing. The query succeeds, the table comes back looking plausible, and the numbers in it describe something other than what you meant to measure. Three pitfalls account for most of that, and each one is easy to avoid once you know it is there.
Times are local, and your own logs are probably UTC. The Capacity Metrics app renders
operation start times in local time. If the artifacts on your side are named in UTC, the offset
between local time and UTC is enough to line your questions up against the wrong rows. Trust the
operation start time column, and note that the Day column does not follow the same
convention.
Do not join to the Items dimension. The Items dimension refreshes once a day at midnight,
so a data agent you created this morning is invisible through it. Microsoft documents that new
items are not visible until the next scheduled refresh after their first operation.
Item History Main[ArtifactName] resolves a newly created data agent within minutes, which is why
every query in this article reads the data agent name from that table instead.
Ignore the utilization chart when you are comparing cost. Smoothing changes when a question’s cost counts against your limit, and it does not change the cost itself, so the chart draws a flattened curve rather than what any one question cost. The CU recorded per operation is the number you want. Smoothing is also why one expensive run can throttle a small capacity for a full day rather than for the length of the run itself.
How many runs before you believe a cost figure
Two runs whose costs come back close together do not tell you the size of the run-to-run noise. The spread across a handful of runs of the same set of questions is wider than any single pair of runs will show you, and that spread has a heavy tail: one run can come back at roughly double the others with no configuration change, and the next run under identical conditions is normal again.
Run each configuration you are testing four to six times. A small difference is not resolvable from a single pair of runs, so a change that looks like a modest improvement is not yet a result.
Which runtime your data agent is on changes how much repetition you need. On the preview runtime the cost of a question varies far less, both between an easy question and a hard one and between one run and the next, and in many cases the cost itself is lower. Fewer runs settle a figure there. We measured that difference on our own capacity, and The Preview Runtime Cut My Fabric Data Agent Cost by 98% is what we found.
Proving that a change lowered the cost per question
Once you have a baseline cost per question, the next thing worth establishing is whether a change you made to the data agent moved that baseline. The procedure below is the one we run.
- Hold everything constant except the one thing you are testing. Two data agents grounded on different table lists carry different amounts of metadata, so comparing one against the other measures the difference between the data agents rather than the effect of your change. Either flip one setting on a single data agent between runs, or create two data agents from the same definition differing in that one setting. Either way you end up with two arms to compare.
- Ask the same question five times against each arm, one at a time, leaving about two and a half minutes between questions. That gap is what puts every question in its own one-minute window in Capacity Metrics, which is what makes a cost per question readable at all.
- Wait fifteen minutes, then match each question to its cost. Billed operations do not come back labeled with the question that caused them, so what you have is a list of timestamped rows. Because you left gaps between your questions, those rows fall into groups separated by idle time, and the group inside the window when you asked a given question is what that question cost. Match every group by its timestamp rather than counting the groups in order and calling the fifth one your fifth question. As soon as two runs share a data agent the groups interleave, and counting in order assigns one run’s costs to the other while the table you end up with still looks reasonable.
- Compare the first question against the rest before you compare the two arms, so that you do not read a warm-up effect as a difference between the two arms.
The two arrangements in step 1 trade setup against time. Flipping a setting on a single data agent takes no preparation, and everything other than that setting is identical across the two runs because it is the same data agent both times. Creating two data agents from one definition costs a few minutes of setup, and in return both arms can run in a single pass. Do not compare two data agents you already have. They almost certainly differ in more than the setting you are testing, and you would read those other differences as the effect of your change.
You do not need separate workspaces for the two arms, and you do not need separate capacities. Two runs of the same data agent are already separable by start time, and moving a data agent to another capacity would only mean querying a different capacity’s metrics.
Introducing AI Readiness in BI Pixie
Measuring what a data agent costs tells you whether your capacity can carry it in production. Whether the answers that data agent returns are correct is a separate question, and AI Readiness in BI Pixie is built for that one.
On 26 August 2026 we released the biggest expansion to BI Pixie, to help you scale your AI investment and take your Power BI semantic models to production with Copilot and Fabric data agents. BI Pixie assesses whether your semantic models are ready for AI, drafts the context they are missing, and creates benchmarks to test your AI against answers computed from your own data. There is a Free plan that assesses up to 500 semantic models, and AI Readiness is available in BI Pixie Workload for Microsoft Fabric or in the cloud version.
Learn more about AI Readiness for Power BI Copilot and Fabric data agents, or read the release announcement.