
Power BI usage metrics do not cover your embedded reports.
You embed Power BI in a product your customers use, or you publish reports to the web for a wider audience. The analytics are part of the value you sell, so how people use them matters as much as any other feature in your app.
Everywhere else in your product you have real analytics. You know which screens people visit, where they stall, what they click. Inside the embedded report, you have nothing.
Why embedded and publish to web viewers go uncounted
Power BI usage metrics do not cover the reports you embed in your own application, and they do not cover the reports you publish to web, so there is nothing you could have configured differently. The one embedding Microsoft does count is a report embedded in SharePoint Online. Microsoft's documentation states the limitation directly and recommends tracking usage in the hosting app instead.
Teams usually reach for two workarounds when Power BI usage metrics do not cover an embedded report, and each one costs more than it first appears. From the Power BI activity log you get tenant-level audit events rather than page-level or visual-level behavior. With the Power BI embedding SDK you can capture the visual a customer clicked and the values they selected, but you then own the event handling, the storage, and the data modeling, which is a project of its own. Microsoft also notes that its data selection event does not cover range or relative slicers, so those selections stay unrecorded whatever you build.
What BI Pixie records for a report inside your application
BI Pixie adds Pixies to the report itself, and Pixies are invisible tracking pixels native to Power BI. Because they are part of the report, the same tracking works wherever the report runs: embedded in your app, published to web, in the Power BI service, and in the Power BI mobile apps.
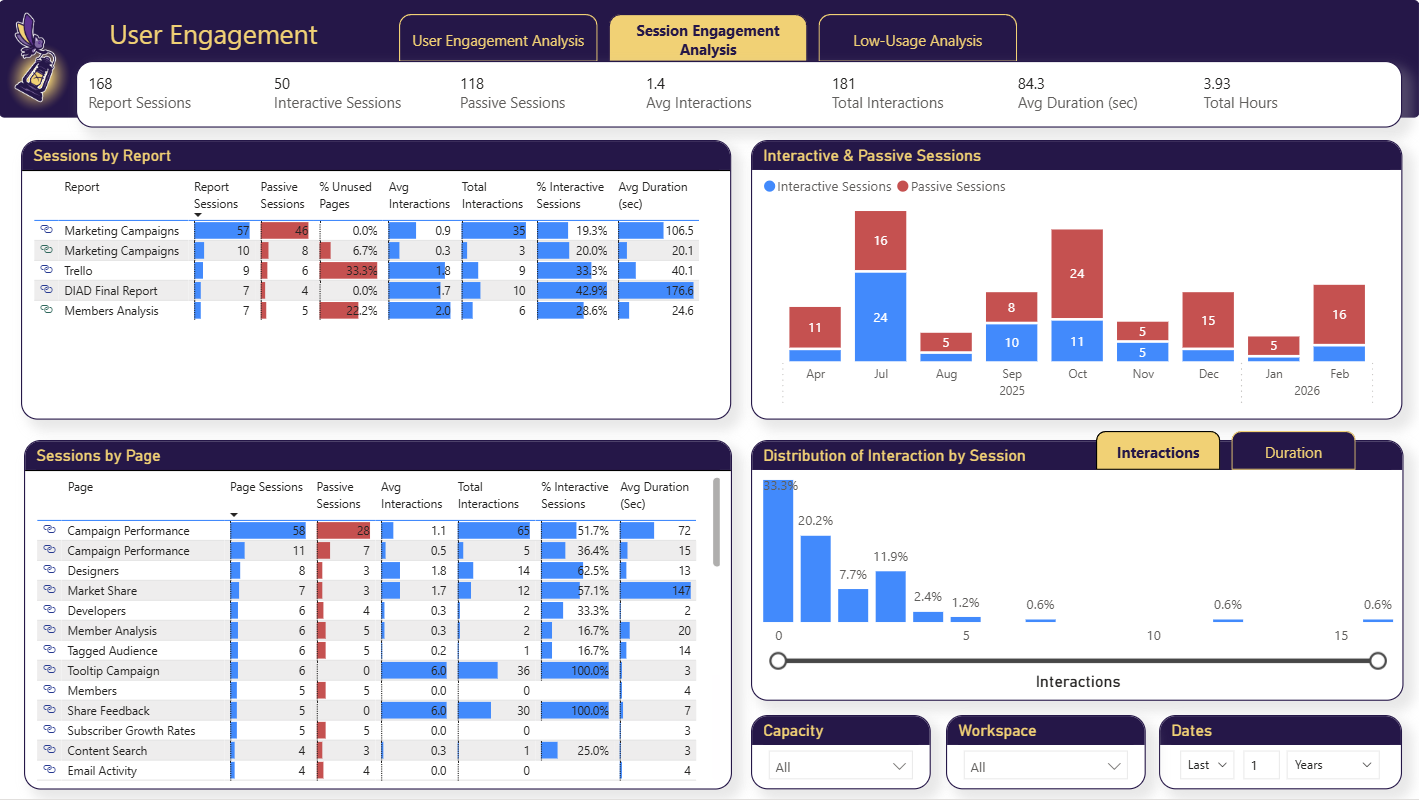
- Clicks at the visual level
- BI Pixie shows which visuals your customers click, mapped to their real position on the page, so you can see what draws attention and what nobody touches. You turn visual-level click tracking on in tracking setup, because it is off by default.
- What your customers filter and select
- BI Pixie records slicer clicks and filter changes, and it can record the values your customers selected, so you learn the questions they are actually asking. Tracking data selections is off until you turn it on in tracking setup.
- Where your customers go deeper
- BI Pixie shows the paths your customers take through the report: drill-through actions, bookmark navigation, and tooltip views.
- Depth of engagement per customer
- BI Pixie shows you, from session duration and interactions per session, whether the analytics in your product are being used or merely loaded.
What it takes to set up
- 1 Connect the workspace holding the reports you embed.
- 2 Add Pixies to those reports. Your embedding code does not change.
- 3 Let your customers keep using the app exactly as before. If you republish the report from Power BI Desktop, open Managed Reports and select Update Pixies, because publishing replaces the report definition that holds the Pixies.
- 4 Review engagement per report, page, and visual in the BI Pixie Dashboard.
Worth knowing: Adding Pixies needs the Contributor, Member, or Admin role on the workspace. The Pixies are part of the report itself, so the tracking needs no change in your application. Telling your customers apart does need one. You embed every view under a single identity, so you pass a customer identifier as CustomData in the embed token. Then you turn on Capture user identity in Tracking Setup, which is off by default. Until you turn it on, BI Pixie collects no user names and tells people apart by a masked IP address.
Related reading
- Add Pixies to your reports
- Use the visual clicks heatmap
- Analyzing clicks in Power BI visuals using a heatmap
Other use cases
- Build your AI plan for Power BI from how people use each report today.
- Copilot gives wrong answers when your semantic model is not ready for it.
- A Copilot that answered correctly last quarter can answer wrongly today.
- Plan a migration to Microsoft Fabric, and prove that it worked.
- Power BI usage metrics record that a report was opened, not what happened next.
- Show the return on your Power BI investment with how people use and value each report.
- Collect satisfaction scores from Power BI users inside the report, not in a separate survey tool.
- Check whether row-level security in Power BI let anyone see data it should have hidden.
- Find the slow Power BI reports that people depend on, and fix those first.
See the data from your own reports
Add Pixies to a report and watch real interaction data arrive. BI Pixie starts free, and the Free plan does not expire.