
Power BI usage metrics record that a report was opened, not what happened next.
You opened the usage metrics report to answer a reasonable question: is this dashboard working? You got view counts and viewer names.
View counts and viewer names tell you the report was opened. They do not tell you whether anyone used it. A user who opens a dashboard every morning, glances at it for five seconds, and moves on looks identical to one who filters, drills, and makes a decision.
Why Power BI usage metrics stop at the open
In Power BI usage metrics you see who opened what, and that part works well. You get view counts, viewer names, and a limited window of history.
The things that separate a working report from an ignored one all happen after the page loads: which visual someone clicked, what they filtered to, whether they drilled through, how long they stayed. Power BI counts the page view and stops there, so none of that behavior appears in usage metrics. Power BI also leaves out the reports you embed in your own application and the reports you publish to web. The one embedding Microsoft does count is a report embedded in SharePoint Online. With only the page view counted, you still cannot say whether a report is working.
What the Pixies record once someone is inside the report
BI Pixie adds Pixies, invisible tracking pixels native to Power BI, and captures what people do after the page loads. It runs alongside Power BI usage metrics rather than replacing them.
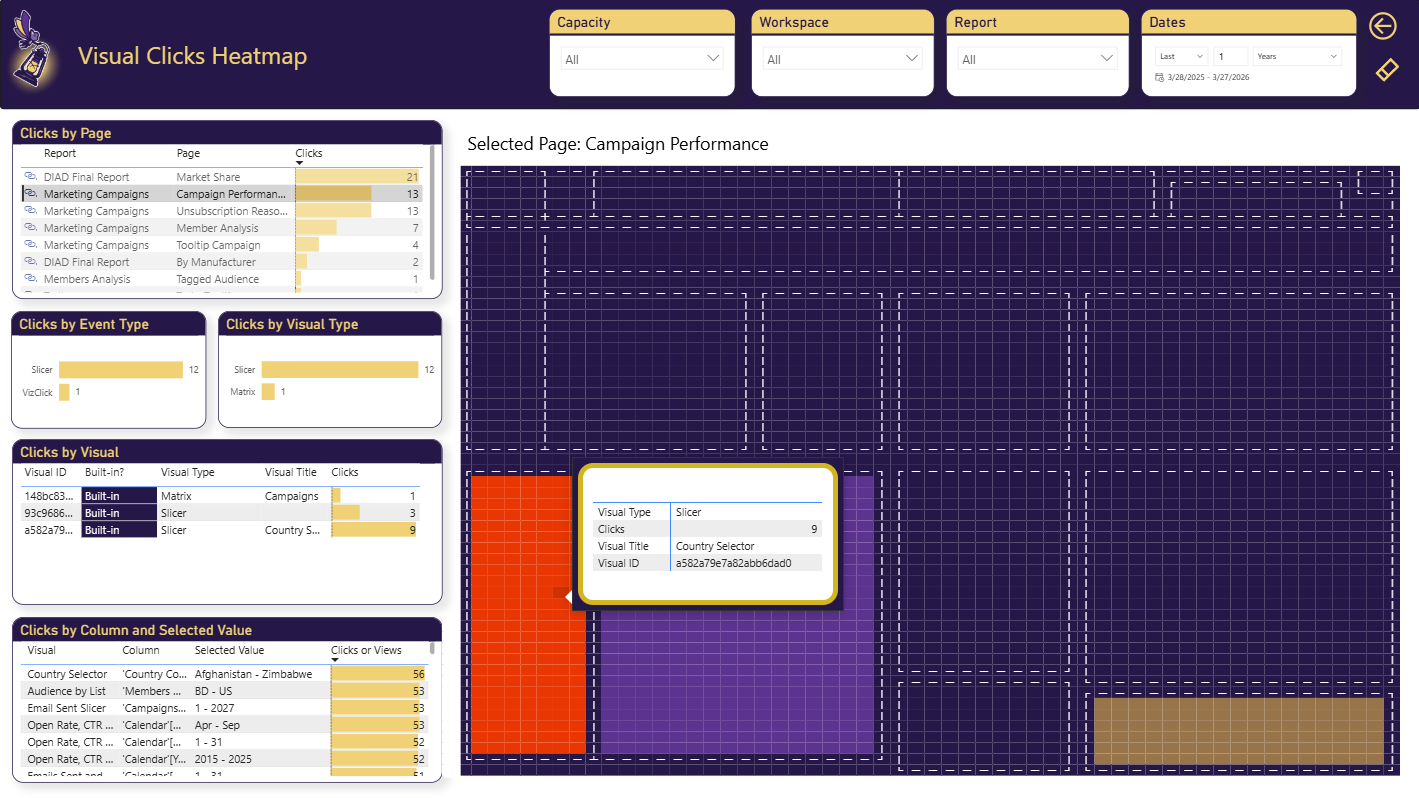
- Every interaction, not just the open
- BI Pixie records slicer selections, filter changes, bookmark navigation, drill-through actions, tooltip views, and clicks on hyperlinks, including the hyperlinks and bookmark actions you place on buttons, images, and shapes. Clicks on individual visuals are available too, and you turn that setting on in tracking setup.
- What data people selected
- BI Pixie can record the values people clicked and filtered to, so you can see which fields and values your report viewers keep coming back to. Tracking data selections is off until you turn it on in tracking setup.
- Active versus passive users
- BI Pixie counts a person as engaged once they click, filter, or navigate in a report, and as passive when their sessions hold only views. Session duration sits beside those counts, so you can also see how long each group stays.
- Satisfaction alongside behavior
- With feedback controls and embedded surveys, you can pair what people did with what they thought.
- Anywhere the report runs
- The same tracking works in the Power BI service, in the Power BI mobile apps, in Power BI Embedded, and in reports you publish to web.
What it takes to set up
- 1 Connect your Power BI workspace and pick the reports you care about.
- 2 Add Pixies. The tracking is invisible to the people reading the report.
- 3 Let people use them as normal.
- 4 Analyze engagement, adoption, and satisfaction in the BI Pixie Dashboard.
Worth knowing: Adding Pixies needs the Contributor, Member, or Admin role on the workspace, and BI Pixie only lists workspaces where you hold one of those. BI Pixie collects viewer user names only when you turn on Capture user identity in Tracking Setup, which lets you analyze behavior per person, and until then it counts viewers by a masked IP address. Tracking the values people select in slicers and visuals is a separate setting that is also off until you turn it on.
Related reading
- What BI Pixie tracks
- BI Pixie metrics reference
- How to differentiate between passive and active Power BI users
- AI Readiness
Other use cases
- Build your AI plan for Power BI from how people use each report today.
- Copilot gives wrong answers when your semantic model is not ready for it.
- A Copilot that answered correctly last quarter can answer wrongly today.
- Plan a migration to Microsoft Fabric, and prove that it worked.
- Show the return on your Power BI investment with how people use and value each report.
- Power BI usage metrics do not cover your embedded reports.
- Collect satisfaction scores from Power BI users inside the report, not in a separate survey tool.
- Check whether row-level security in Power BI let anyone see data it should have hidden.
- Find the slow Power BI reports that people depend on, and fix those first.
See the data from your own reports
Add Pixies to a report and watch real interaction data arrive. BI Pixie starts free, and the Free plan does not expire.