
Set up BI Pixie Dashboard
The BI Pixie Dashboard is a Power BI report that turns your engagement data into insights about how your audience uses your reports. It shows which reports get viewed, which visuals get clicked, who returns, and where users focus their attention, so you can see what is delivering value and where to iterate next.
User satisfaction, survey analysis, data auditing, and row-level security are all covered in the same dashboard. See the BI Pixie Dashboard walkthrough for a full tour of every page and metric.
BI Pixie installs the Dashboard in your Fabric workspace automatically when you create the BI Pixie item. There are no credentials to set up; once it is installed, you load your engagement data with a single click.
What gets installed
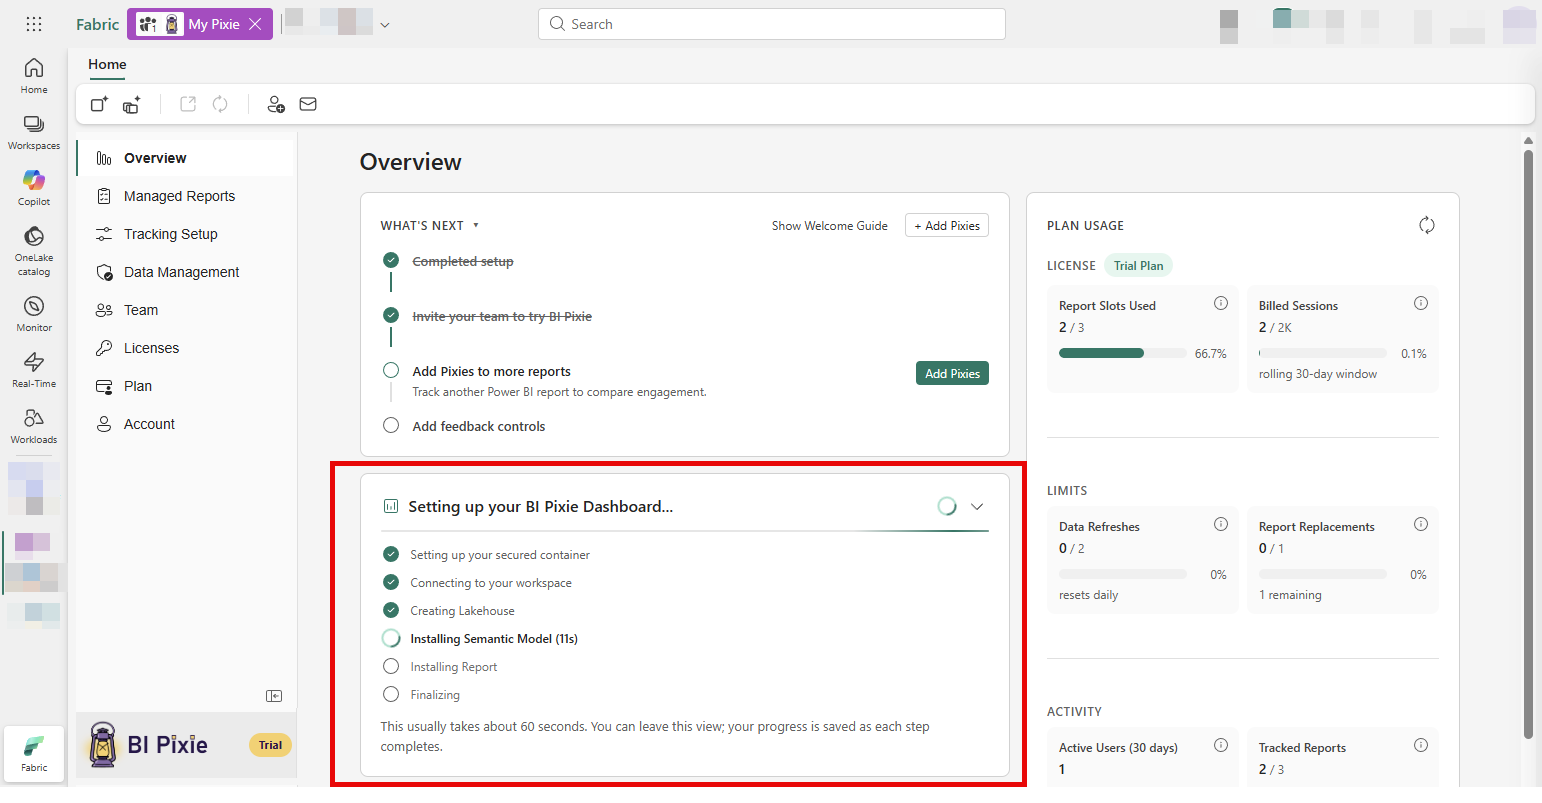
The Dashboard installs in the background as soon as you create the BI Pixie item. The install takes about 60 seconds, and the BI Pixie item shows live progress while it runs.
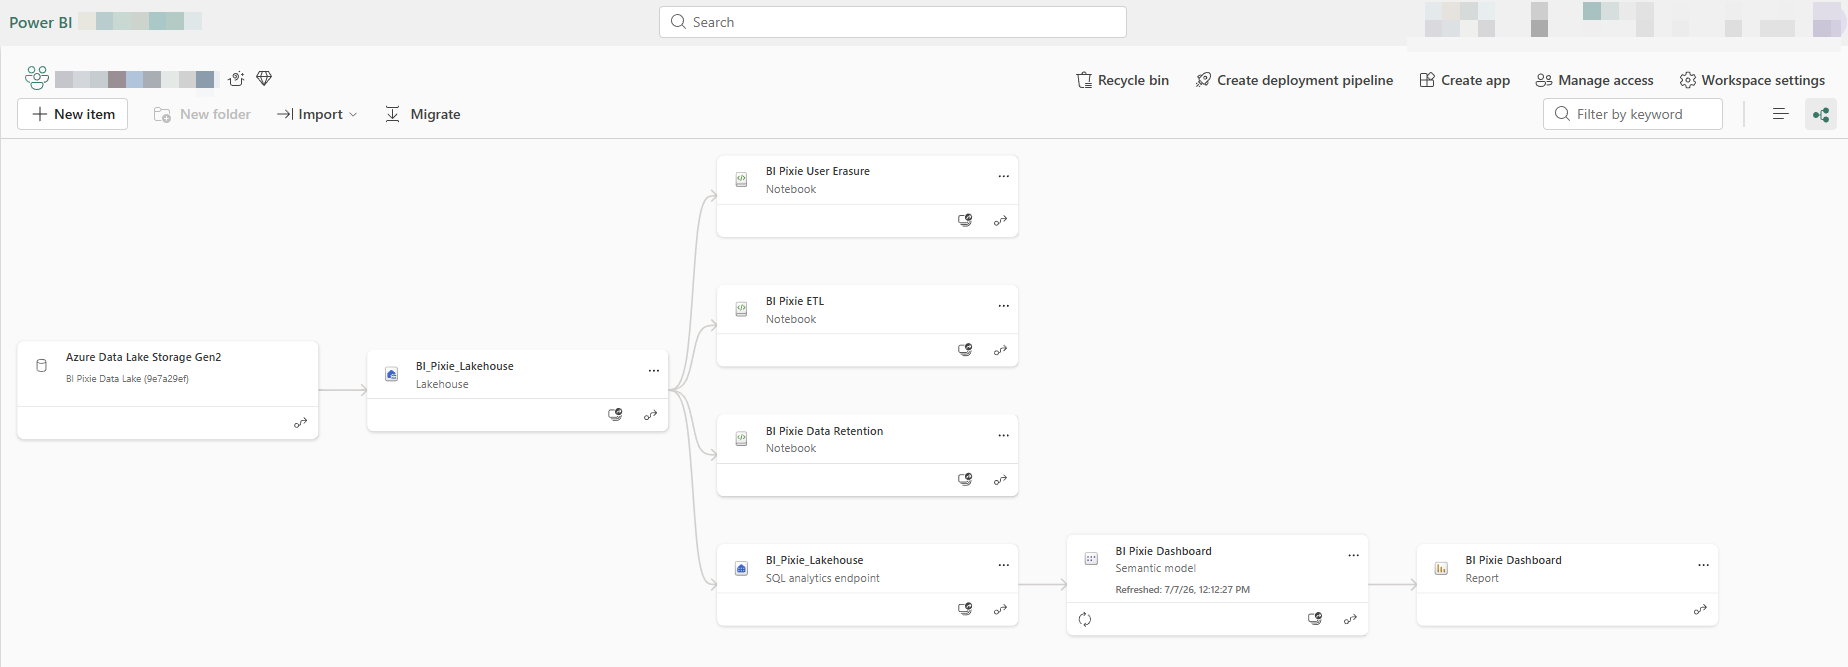
When it finishes, you will find a new BI Pixie folder in your Fabric workspace containing these items:
- A Lakehouse called BI_PIXIE_Lakehouse. It includes a OneLake shortcut to your BI Pixie telemetry data.
- A notebook called BI Pixie ETL. It builds the dashboard's data tables from your telemetry and updates the model. You run it to load and refresh data; see Load your data below.
- A Semantic Model called BI Pixie Dashboard. It reads the data tables directly with Direct Lake, so there are no credentials to set up.
- A Power BI report called BI Pixie Dashboard. This is the dashboard you open to see your engagement insights.
No credentials to set up
The Dashboard reads your engagement data with Direct Lake over the BI Pixie Lakehouse, so there are no data source credentials to configure. The connection to your telemetry is provisioned automatically while the BI Pixie item installs. The first time you open the item you may see a one-time Microsoft consent prompt; approve it with your organizational account (the same one you use for Fabric) and setup completes itself.
Load your data
A freshly installed Dashboard starts empty. To load your engagement data, run the BI Pixie ETL notebook once: in the BI Pixie item's Overview, open the BI Pixie Dashboard card and click Refresh data. This runs the notebook, which builds the data tables from your telemetry and updates the model when it finishes. You can also open the BI Pixie ETL notebook in your workspace and run it directly.
The first run can take a few minutes, depending on how much telemetry you have collected. When it completes, open the BI Pixie Dashboard report to see your insights.
Keep your data fresh
Each time you click Refresh data, BI Pixie runs the ETL notebook to load the latest engagement data and update the model. Your BI Pixie subscription includes a daily refresh allowance, which you can monitor on the Account page under Data Refreshes.
To update the Dashboard automatically, schedule the BI Pixie ETL notebook to run on a schedule from your Fabric workspace (for example, daily). Scheduled runs use your Fabric capacity. Because the Dashboard uses Direct Lake, there is no separate semantic model refresh to configure.
Customize the Dashboard
Recommended ways to customize without losing your work on the next update:
- Build a thin report (recommended). Create a new Power BI report that connects live to the BI Pixie Dashboard semantic model. You get full design freedom, and the report is yours, so BI Pixie never changes it. This is the best path for most customizations.
- Save a copy of the report. Open the BI Pixie Dashboard report in your workspace and use File > Save a copy to create your own editable version. Edit the copy freely; it stays live-connected to the semantic model.
- Save a copy of the notebook. Use the BI Pixie ETL notebook's Save as option to fork it before you change its logic.
- Add your own measures and tables. Put custom DAX measures in your thin report, and write any derived tables to a Lakehouse of your own rather than the managed one.
- Share with your team. Share the Fabric workspace, or publish a Power BI app, so stakeholders can access engagement insights without needing access to the BI Pixie item.
You can edit the original report or model directly, for example to tweak a color before a one-off screenshot, but those edits are replaced the next time you update the dashboard. For anything you want to keep, customize a copy.
Because the data in the semantic model stays inside your own Microsoft Fabric tenant, you can also use Copilot and AI agents to query your usage data using natural language.