
Getting Started
This guide walks you through signing in to BI Pixie, exploring the BI Pixie portal, and getting ready to add Pixies to your first Power BI reports. You will be ready to track usage in minutes.
Step 1: Sign In
- Go to app.bipixie.com.
- Click Sign in with Microsoft.
- Sign in with your Microsoft work or school account (the same account you use for Power BI).
- If this is your first time, BI Pixie will provision your account automatically. You will be redirected to the Overview page.
Note: BI Pixie uses Microsoft Entra ID (Azure AD) for authentication. There is no separate registration form. Your account is created when you first sign in.
If you return later, the sign-in page will greet you with "Welcome back" and you can sign in again with a single click.
If your organization's policy blocks sign-in
Some organizations restrict which applications users can sign in to. If you see an error like "Need admin approval" or "AADSTS65001", your Microsoft Entra ID tenant requires an administrator to approve BI Pixie before you can use it. To resolve this:
- Send your IT administrator Permissions and Data Access, which lists every permission BI Pixie requests with the reason it is needed, and states what BI Pixie reads, writes and stores. That page is written to be read on its own by somebody with no BI Pixie account.
- If your organization uses the Microsoft Entra admin consent workflow, you can request approval from the screen that showed the message. Your administrator reviews the request under Enterprise applications > Admin consent requests.
- Once your administrator approves BI Pixie under your organization's process, sign in again.
None of the permissions BI Pixie requests requires an administrator. This approval is needed only because your organization's own policy requires it. If you need more help, contact us.
Step 2: Explore the Overview Page
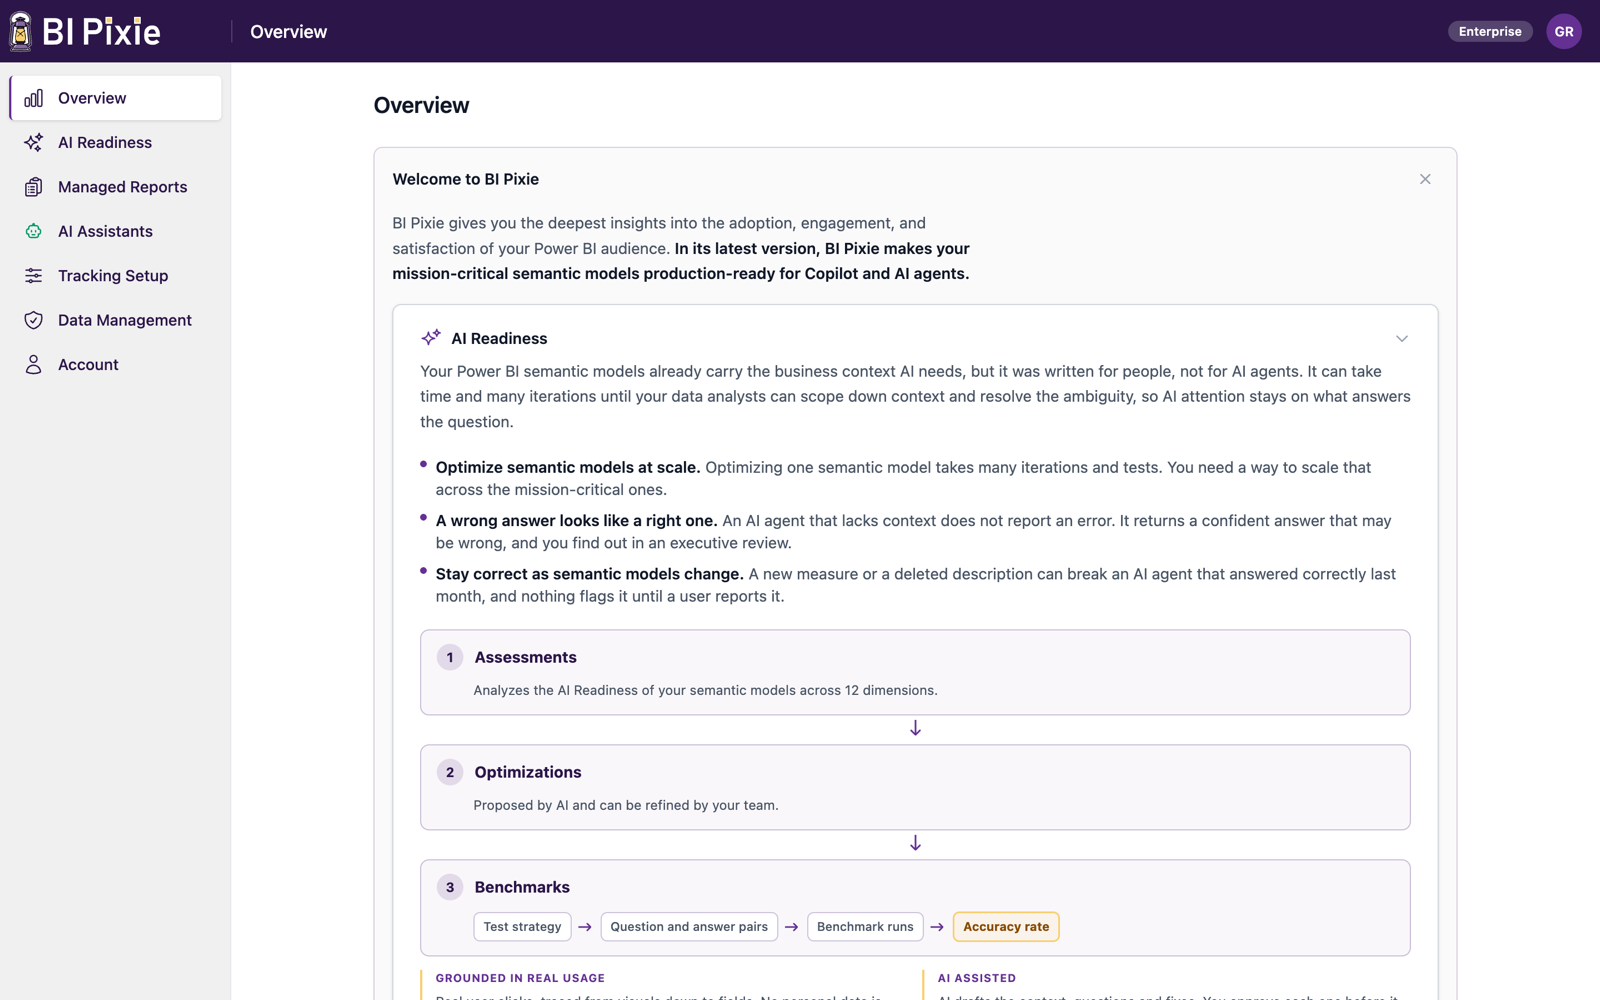
After signing in, you land on the Overview page. This is your home base in the BI Pixie portal, and it opens with two sections:
Welcome Guide
A collapsible set of cards that explain what BI Pixie is and how it works. Includes a comparison table showing what BI Pixie tracks compared to native Power BI (page views, visual clicks, filter selections, bookmarks, tooltips, drill-through, and more). You can close the Welcome Guide and reopen it any time with the "Show Welcome Guide" link.
Getting Started Checklist
A step-by-step checklist that guides you through initial setup. It starts with:
- Connect to Power BI: Links to the Add Pixies page where you connect your Power BI account.
- Add Pixies to your first report: Links to the Add Pixies page to add Pixies to a report.
- Install BI Pixie Dashboard: Install the Power BI template app to analyze your data.
After you add Pixies to your first report, the checklist expands with additional steps like enabling feedback controls, adding surveys, enabling RLS tracking, and inviting team members. The checklist adapts based on your plan and role.
Where to See Your Usage
To see your usage metrics, open the Account page from the left sidebar and select the Usage tab. It shows your plan, followed by your metrics organized into sections: License (plan allowances), AI Readiness (assessment and benchmark allowances), Limits (daily quotas), and Activity (engagement data and trends):
- Tracked Items: How many of your plan's tracked items are in use. A tracked item is a report with Pixies, or a semantic model or data agent you are preparing for AI; see What Counts as a Tracked Item for the full definition.
- Sessions: Your sessions this period against your plan's fair-use allowance. A session = one person using one report on one day. Sessions are never billed; see Data Retention at Extreme Usage for how the allowance works and what happens far beyond it.
- Benchmark runs and Free first-look assessments: Your AI Readiness allowances and how much of each you have used.
- Data Refreshes: How many data refreshes your BI Pixie Dashboard used today.
- Active Users (30 days): Unique users interacting with your reports in the rolling 30-day window.
- Tracked Reports: How many of your reports with Pixies have received event data.
- Latest Activity: When the most recent event was received.
- Retention: How many days of event history you are storing.
- Data Captured: Total size of your stored event data.
- Daily Average: Average data captured per day across your tracking period (shown when data spans multiple days).
Step 3: Connect to Power BI and Add Pixies
To start tracking, you need to connect your Power BI account and add Pixies to at least one report. This is covered in detail in the next guide.
- From the Overview checklist, click Connect to Power BI.
- Click Connect to Power BI to sign in and grant BI Pixie access to your workspaces.
- Select a workspace and choose which reports to track.
- Choose whether to download the report definitions as a ZIP for testing or use auto-save to write directly to your workspace. See Add Pixies to Your Reports for more details.
- Click "Download with Pixies" or "Save to Power BI" to add Pixies to the selected reports.
See Add Pixies to Your Reports for the complete walkthrough.
Step 4: Score Your First Semantic Model
Tracking answers how people use your reports, and it needs a few days of activity before the answers get interesting. AI Readiness answers a different question immediately: how well prepared your semantic models are for Copilot and for Fabric data agents. There is nothing to wait for, so this is the fastest useful thing you can do on your first visit.
- Open AI Readiness from the left sidebar.
- Click Start assessment and pick a semantic model. You can select several and assess them in one run.
- Read the AI Readiness score, 0 to 100, with its band. One score covers Copilot and Fabric data agents alike; descriptions, AI Instructions, and the AI data schema all move it.
- Open Why this score? for the points each dimension deducted, then open Optimize semantic model below the score card to review the fixes BI Pixie can write for you.
Scoring is read-only: nothing is written to your semantic model. Once the semantic model's reports are tracked and have collected some usage, reassess it: the score becomes grounded in what people actually click, which sharpens both the score and the order of the findings.
What's Next
- Add Pixies to Your Reports: Add tracking Pixies to your Power BI reports.
- Tracking Setup: Customize tracking options, enable feedback controls, and configure surveys.
- Managed Reports: View and manage your tracked reports.
- AI Readiness: Score and improve your semantic models, included in every plan.