
Set up BI Pixie Dashboard
In this section, you will learn how to set up BI Pixie Dashboard to connect to the data that BI Pixie collects and allow you to analyze your Power BI reports through the lens of adoption, engagement, user satisfaction, business outcome, performance and security.
BI Pixie Dashboard is available on Microsoft AppSource as two different apps.
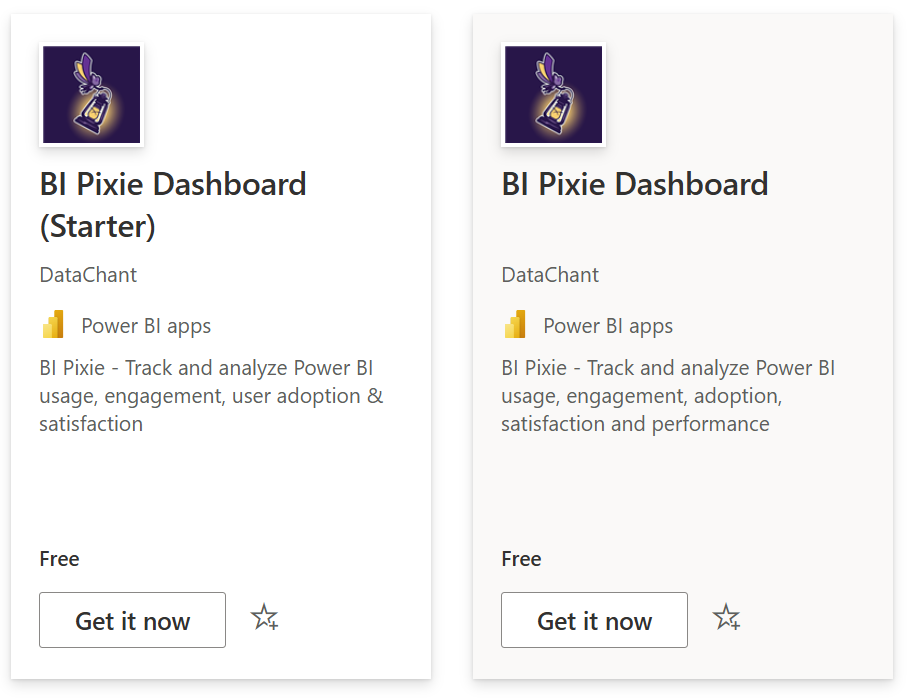
BI Pixie Dashboard (Starter) is the version that connects to the Microsoft Dataverse tables of your BI Pixie Starter Deployment (If you haven't installed it yet, follow this guide).
BI Pixie Dashboard is the version that connects to your Azure Storage account in the BI Pixie Azure Deployment (If you haven't installed it yet, follow this guide).
Note: Throughout the user guide, we may refer to BI Pixie Dashboard as "BI Pixie Analytics", "BI Pixie Power BI App", or "BI Pixie App". Consider these terms as synonyms. Also note that "BI Pixie Dashboard" is not a "dashboard" item in Power BI. It is a Power BI Template App that was certified and approved by Microsoft. You can learn more about Power BI Template Apps here.
After you install BI Pixie Dashboard as described in this article, you will have the following Power BI components in your Power BI service:
- A workspace that contains the following items:
- A report that can be customized in Editing view on Power BI service (Learn more here).
- A semantic model
- An app that is connected to the workspace and can be shared with your audience.
How the two Power BI apps differ
| Attributes | BI Pixie Dashboard (Starter Version) | BI Pixie Dashboard |
|---|---|---|
| Data source | BI Pixie Microsoft Dataverse tables in your Power Platform environment | BI Pixie's container in your Azure Data Lake Storage Account |
| Data source is deployed by | BI Pixie Starter Deployment on AppSource | BI Pixie Azure Deployment on Azure Marketplace |
| Unsupported features | Performance, Business Impact, RLS Auditing, Data Export Auditing, Custom Visuals Heatmap |
In the next section of this article, you learn how to install the Starter version of BI Pixie Dashboard and connect it to your Dataverse tables.
You can skip Starter section and move to the Azure section below, if you deployed or plan to deploy BI Pixie on Azure.
After you install this dashboard you can connect it to your Azure Storage or Dataverse tables where you have already deployed BI Pixie. However, if you wish to explore the dashboard using our sample data, you can install it without connecting it. Click one of the two buttons below to install the app in your Power BI service.
Starter Version Instructions
After you install BI Pixie Dashboard as a Power BI app from Microsoft AppSource, open the app and explore the different report pages with the sample data. After you completed the setup of BI Pixie Power Platform and completed the instrumentation and testing of your Power BI project files, it's time to connect the Power BI app with your data. Open the app and select Connect your data.
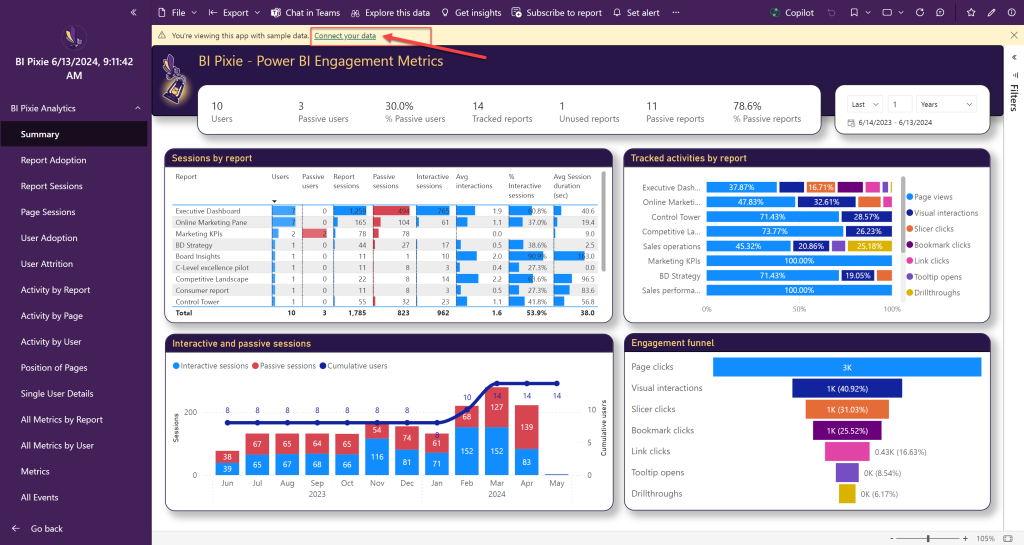
To connect the the starter version of BI Pixie Dashboard, you will need to enter the domain name of the Power Platform environment that you use. In a new browser tab, go to https://make.powerapps.com, and in the environments drop down select the environment you use to collect the pixie events (as was described here).
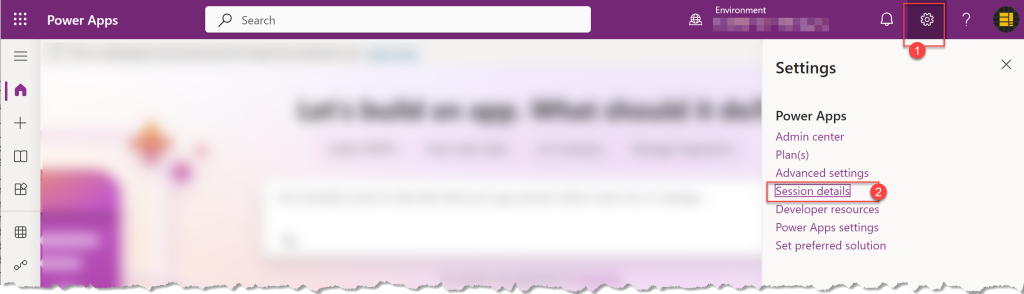
Click the gear icon at the top right side of Power Apps page and select Session details.
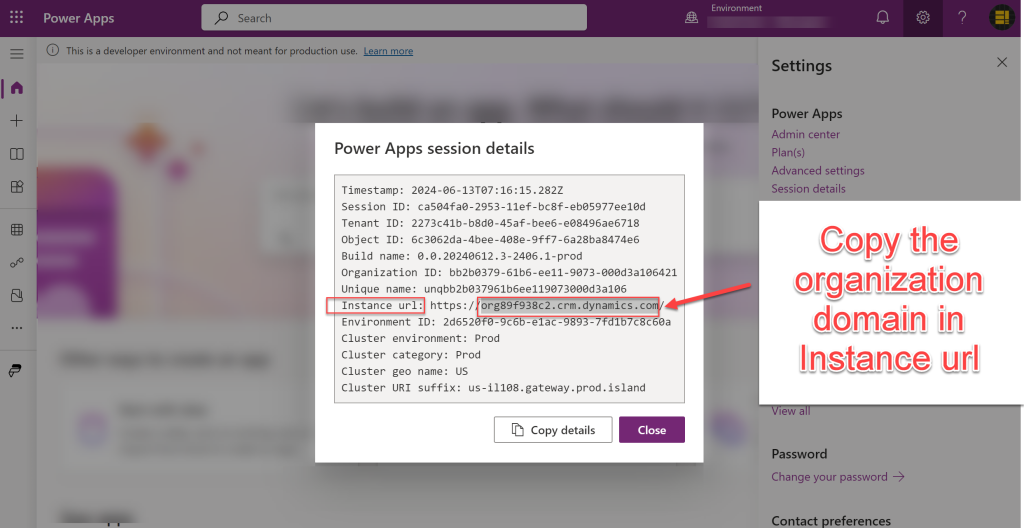
Find the Instance url line and copy the organization domain that is highlighted below. The organization domain should not include the https:// prefix or the last /. Copy only the part with the format org*.crm.dynamics.com
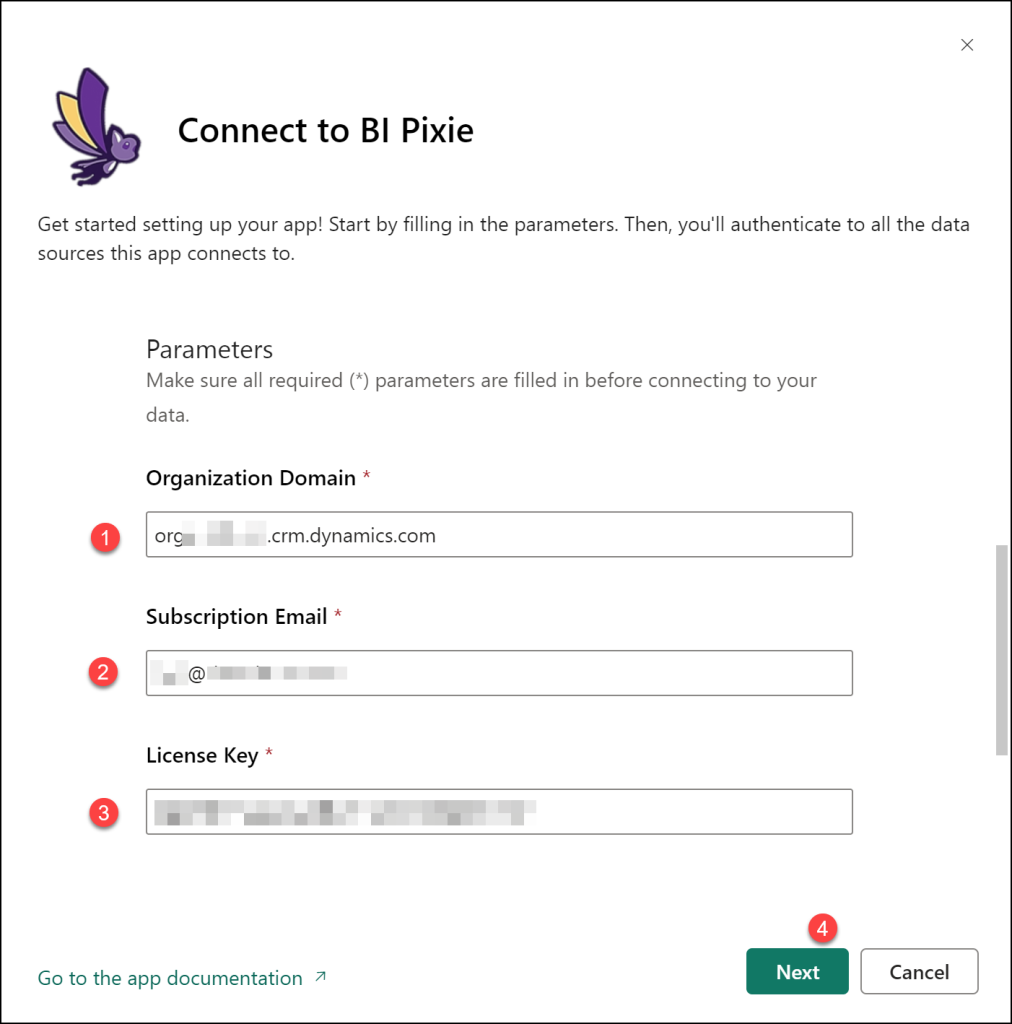
Go back to the browser tab where you previously clicked Connect your data in your Power BI app. In Connect to BI Pixie page, enter the organization domain name from the previous step in Organization Domain.
Enter the same email address for your BI Pixie license or subscription in Subscription Email. Finally, enter the license key you received from us in License Key (This is the same key you use in the configuration file of BI Pixie Instrumentation).
If you intend to track usage and engagement of anonymous users only, set the optional parameter Are Users Anonymous to TRUE. This parameter will ignore the user names and treat only IP addresses as the user key in the BI Pixie Dashboard. If you intend to analyze both anonymous and authenticated users, it is recommended to install this Power BI app twice. Use Are Users Anonymous to FALSE in the app that is dedicated to analyze the authenticated users, and use TRUE in the app that should analyze the anonymous users.
When you are done, enter Next.
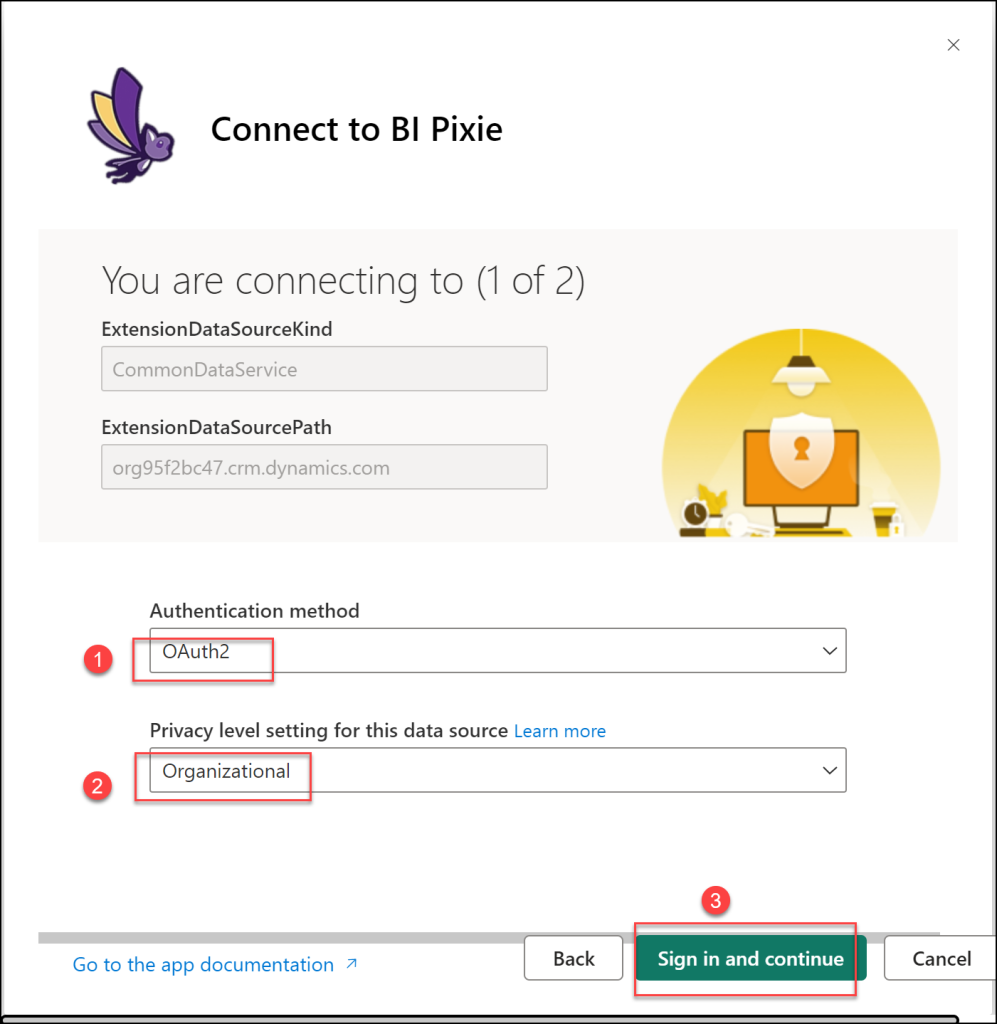
In the next page, make sure that OAuth2 is selected as Authentication method, and that Organizational is selected as Privacy level setting for this data source. Then, click Sign in and continue.
In the next page, make sure that Anonymous is selected as Authentication method, and that Organizational is selected as Privacy level setting for this data source. Then, click Sign in and connect.
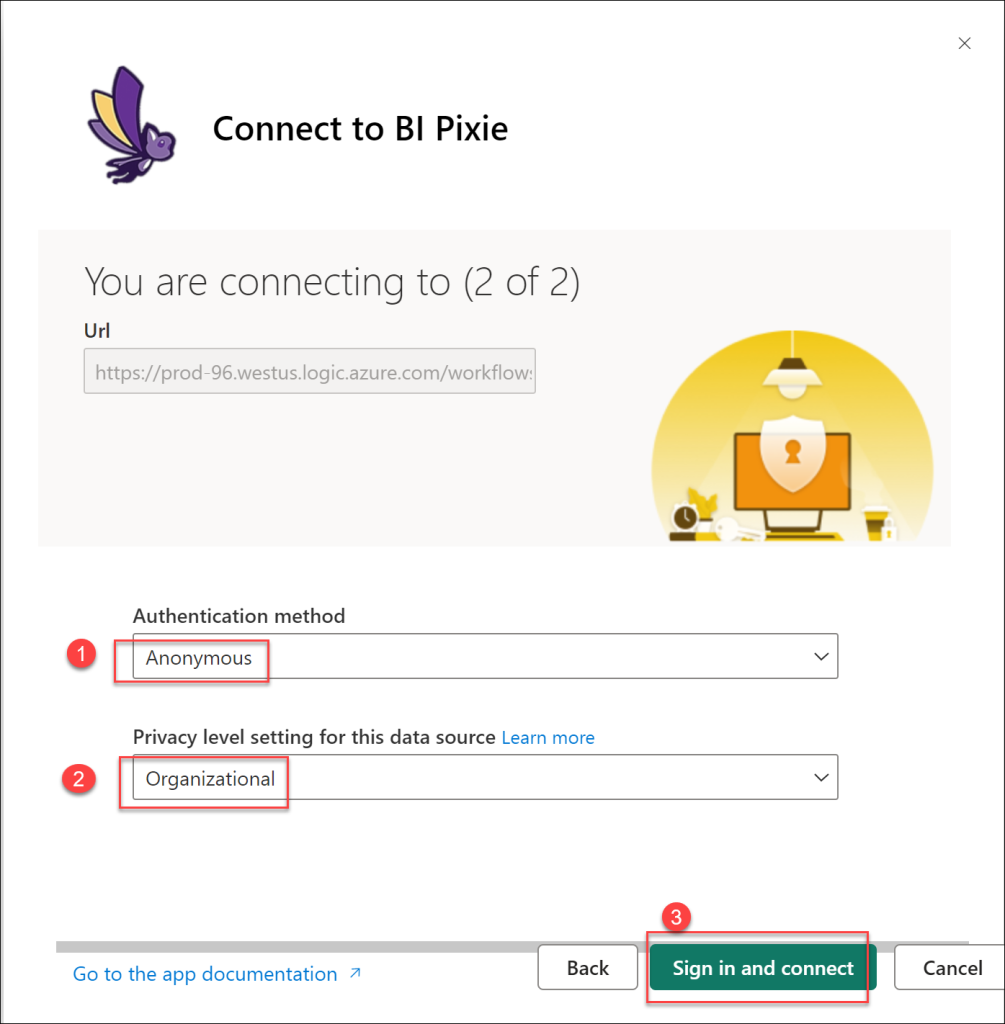
The semantic model of the app will now connect to BI Pixie Events dataverse table and import the usage and engagement data that is tracked by BI Pixie. The refresh can be long if you have large amount of records in BI Pixie Events.
Azure Version Instructions
After you install the Azure version of the app from Microsoft AppSource here, select BI Pixie Enterprise app and explore the different report pages with the sample data. After you completed the setup of the Azure components, it's time to connect the Power BI app with your data. Open the app and select Connect your data.
Enter the Data Lake URL. Make sure you enter the relevant components correctly. Don't use "/" at the end.
https://[bipixie storage name].dfs.core.windows.net/[container name]
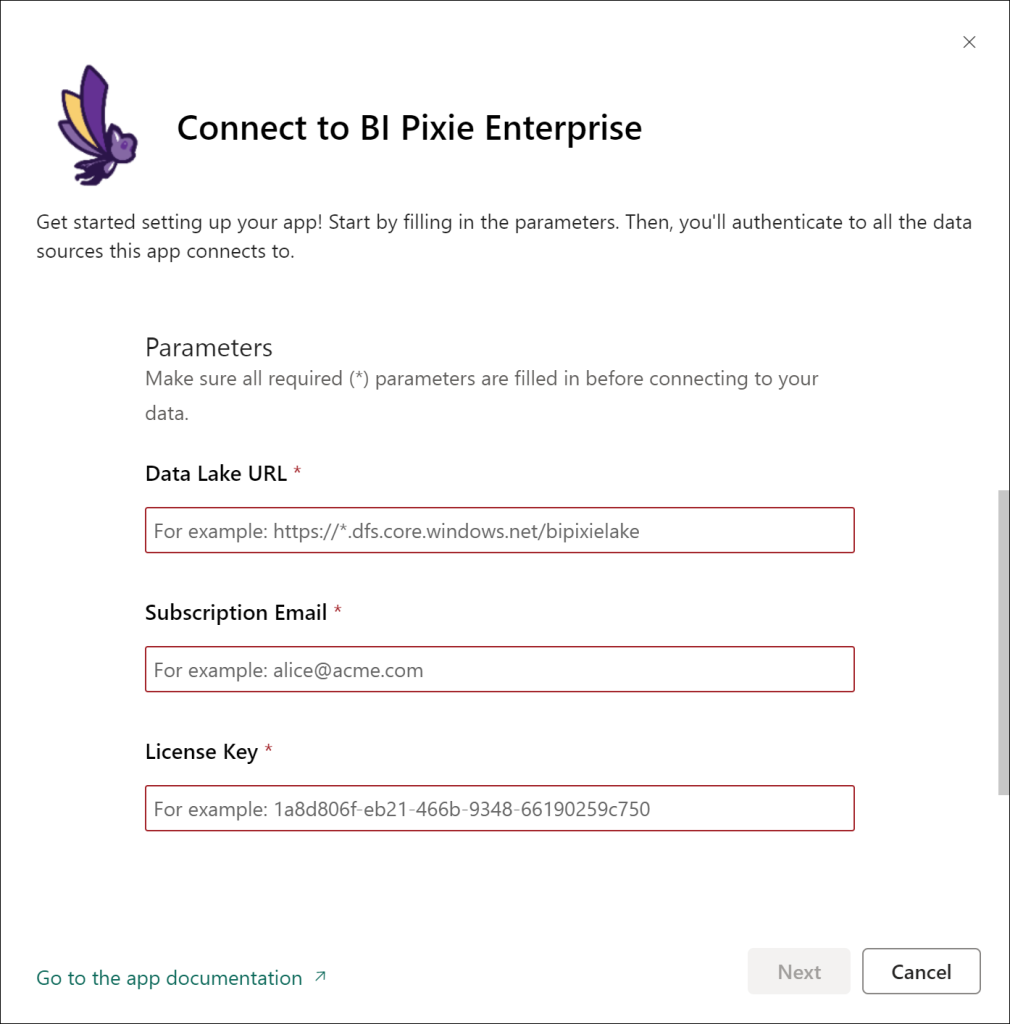
Enter the same email address for your BI Pixie license or subscription in Subscription Email. Finally, enter the license key you received from us in License Key (This is the same key you use in the configuration file of BI Pixie Instrumentation).
If you intend to track usage and engagement of anonymous users only, set the optional parameter Are Users Anonymous to TRUE. This parameter will ignore the user names and treat only IP addresses as the user key in the BI Pixie Dashboard. If you intend to analyze both anonymous and authenticated users, it is recommended to install this app twice. Use Are Users Anonymous to FALSE in the app that is dedicated to analyze the authenticated users, and use TRUE in the app that should analyze the anonymous users.
When you are done, enter Next.
In the next page, select OAuth2 (Organizational account) as the Authentication method, and select Organizational in Privacy level setting for this data source. The semantic model then refreshes with the Microsoft Entra sign-in of the person who connects it, and no storage account key or Shared Access Signature (SAS) is involved.
That person needs the Storage Blob Data Reader role on the BI Pixie storage account, or on its bipixielake container. An Azure administrator can assign it in the Azure portal, under Access control (IAM) on the storage account. Power BI reads the storage account through this role. Access control lists (ACLs) on folders are not enough. The person must also belong to the same Microsoft Entra tenant as the storage account, because Power BI does not refresh from a storage account in another tenant with an organizational account.
This is the only connection that keeps working when storage account keys are turned off. BI Pixie installs with the keys on. To move an installation on Flex Consumption onto managed identities and then turn the keys off, ask BI Pixie support for the use-managed-identity.ps1 script and the roles template it deploys, and run the script after you connect the dashboard this way. The script grants each function app the roles it needs, switches the apps to their managed identities once the roles take effect, and turns the keys off only when you ask it to. It only reports what it would change until you run it with -Mode Apply. Your organization's Azure administrator may need to run it, and the managed application's lock on its resource group can refuse the change. If your storage account keeps its keys, you can still choose Shared Access Signature (SAS) instead. Generate the SAS token at the bipixielake container level and grant both the Read and List permissions. A SAS stops working, and the refresh fails, if the storage account keys are turned off or rotated.
Then, click Sign in and continue.
In the second page, make sure that Anonymous is selected as Authentication method, and that Organizational is selected as Privacy level setting for this data source. Then, click Sign in and continue.
The second data source (raw.githubusercontent.com) allows BI Pixie Dashboard to import data from DataChant's repository here. With this data, BI Pixie knows all the available Custom Visuals on Microsoft AppSource and analyze engagement, performance and risks of custom visuals by their origin (Built-in visuals, Certified custom visuals, Uncertified custom visuals, Unlisted or Unknown).
In the third page, make sure that Anonymous is selected as Authentication method, and that Organizational is selected as Privacy level setting for this data source. Then, click Sign in and connect.
The third data source (prod-96.westus.logic.azure.com) is BI Pixie's backend that is used for license check.
The semantic model of the app will now connect to your Data Lake storage and import the usage and engagement data.